

Question
Does not have to be long Report: Prepare a report analyzing your companys financial status. The discussion should include paragraphs on liquidity ratios, profitability ratios,
Does not have to be long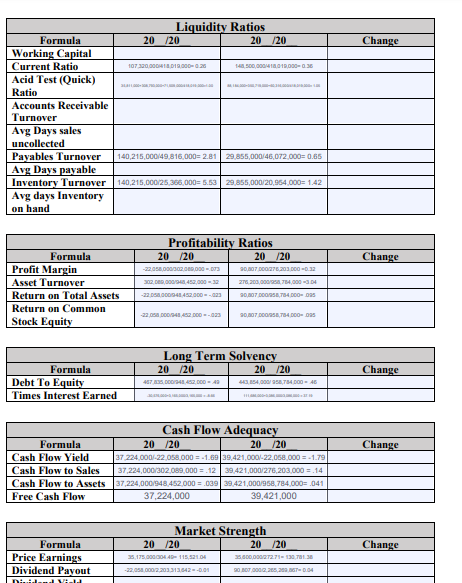
Report: Prepare a report analyzing your companys financial status. The discussion should include paragraphs on liquidity ratios, profitability ratios, long term solvency, cash flow adequacy, and market strength. Remember the introductory paragraph and the summary paragraph.
Your Opinion: State reasons you would or would not INVEST in the companies and if you would or would not accept EMPLOYMENT with these companies.
Your Opinion: State what you have learned from this project.
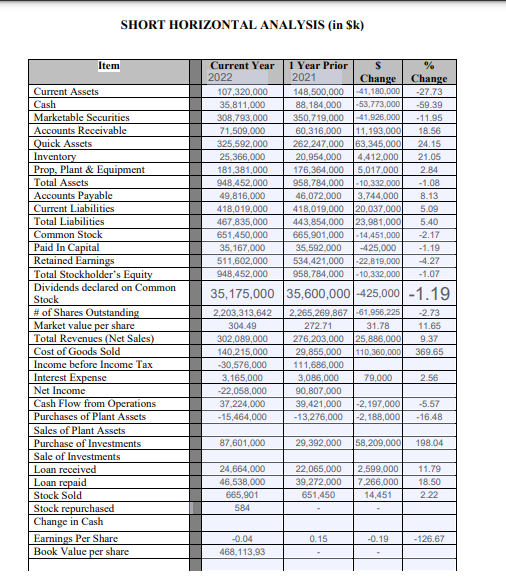
\begin{tabular}{|l|l|l|l|} \hline \multicolumn{5}{|c|}{ Liquidity Ratios } \\ \hline \multicolumn{1}{|c|}{ Formula } & 20/20 & 20/20 & Change \\ \hline Working Capital & & & \\ \hline Current Ratio & & & \\ \hline AcidTest(Quick)Ratio & & & \\ \hline AccountsReceivableTurnover & & & \\ \hline AvgDayssalesuncollected & & & \\ \hline Payables Turnover & 140,215,000/49,816,000=2.81 & 29,855,000/46,072,000=0.65 & \\ \hline Avg Days payable & & & \\ \hline Inventory Turnover & 140,215,000/25,365,000=5.53 & 29,855,000/20,954,000=1.42 & \\ \hline AvgdaysInventoryonhand & & & \\ \hline \end{tabular} \begin{tabular}{|l|c|c|c|} \hline \multicolumn{5}{|c|}{ Long Term Solvency } \\ \hline \multicolumn{1}{|c|}{ Formula } & 20/20 & 20/20 & Change \\ \hline Debt To Equity & 20 & \\ \hline Times Interest Earned & & & \\ \hline \end{tabular} \begin{tabular}{|l|c|c|c|} \hline \multicolumn{5}{|c|}{ Cash Flow Adequacy } \\ \hline \multicolumn{1}{|c|}{ Formula } & 20/20 & 20/20 & Change \\ \hline Cash Flow Yield & 37,224,00022,058,000=1.69 & 39,421,000/22,068,000=1.79 & \\ \hline Cash Flow to Sales & 37,224,000302,059,000=.12 & 39,421,000/276,203,000=.14 & \\ \hline Cash Flow to Assets & 37,224,000998,452,000=.039 & 39,421,000/958,784,000=.041 & \\ \hline Free Cash Flow & 37,224,000 & 39,421,000 & \\ \hline \end{tabular} SHORT HORIZONTAL ANALYSIS (in \$k) \begin{tabular}{|l|l|l|l|} \hline \multicolumn{5}{|c|}{ Liquidity Ratios } \\ \hline \multicolumn{1}{|c|}{ Formula } & 20/20 & 20/20 & Change \\ \hline Working Capital & & & \\ \hline Current Ratio & & & \\ \hline AcidTest(Quick)Ratio & & & \\ \hline AccountsReceivableTurnover & & & \\ \hline AvgDayssalesuncollected & & & \\ \hline Payables Turnover & 140,215,000/49,816,000=2.81 & 29,855,000/46,072,000=0.65 & \\ \hline Avg Days payable & & & \\ \hline Inventory Turnover & 140,215,000/25,365,000=5.53 & 29,855,000/20,954,000=1.42 & \\ \hline AvgdaysInventoryonhand & & & \\ \hline \end{tabular} \begin{tabular}{|l|c|c|c|} \hline \multicolumn{5}{|c|}{ Long Term Solvency } \\ \hline \multicolumn{1}{|c|}{ Formula } & 20/20 & 20/20 & Change \\ \hline Debt To Equity & 20 & \\ \hline Times Interest Earned & & & \\ \hline \end{tabular} \begin{tabular}{|l|c|c|c|} \hline \multicolumn{5}{|c|}{ Cash Flow Adequacy } \\ \hline \multicolumn{1}{|c|}{ Formula } & 20/20 & 20/20 & Change \\ \hline Cash Flow Yield & 37,224,00022,058,000=1.69 & 39,421,000/22,068,000=1.79 & \\ \hline Cash Flow to Sales & 37,224,000302,059,000=.12 & 39,421,000/276,203,000=.14 & \\ \hline Cash Flow to Assets & 37,224,000998,452,000=.039 & 39,421,000/958,784,000=.041 & \\ \hline Free Cash Flow & 37,224,000 & 39,421,000 & \\ \hline \end{tabular} SHORT HORIZONTAL ANALYSIS (in \$k)Step by Step Solution
There are 3 Steps involved in it
Step: 1

Get Instant Access to Expert-Tailored Solutions
See step-by-step solutions with expert insights and AI powered tools for academic success
Step: 2

Step: 3
Ace Your Homework with AI
Get the answers you need in no time with our AI-driven, step-by-step assistance
Get Started
Financial Accounting Working Papers Tools For Business Decision Making
Authors: Paul D. Kimmel ,Jerry J. Weygandt ,Donald E. Kieso
6th Edition
0470887931, 978-0470887936