Does the model yield logical estimates with respect to intrinsic value and time-to-maturity? What happens to the option premiums as you change the volatility? Can you explain why volatility affects prices in such a manner?
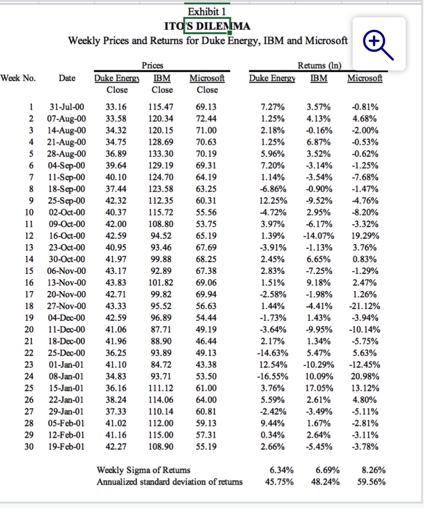
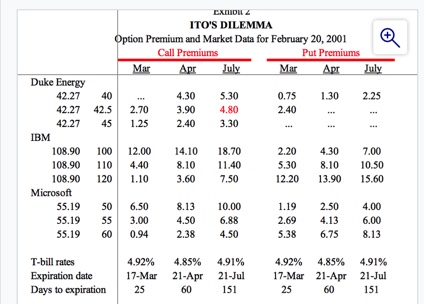
Exhibit 1 ITO'S DILEMMA Weekly Prices and Returns for Duke Energy, IBM and Microsoft Prices Returns (In) Week No. Date Duke Energy IBM Microsoft Duke Energy IBM Microsoft Close Close Close 31-Jul-00 33.16 115.47 69.13 7.27% 3.57% -0.81% 07-Aug-00 33.58 120.34 72.4 1.25% 4.13%% 4.68%% .UN- 14-Aug-00 34.32 120.15 71.00 2.18% -0.16% -2.00% 21-Aug-00 34.75 128.69 70.63 1.25% 6.87% -0.53% 28-Aug-00 36.89 133.30 70.19 5.96% 3.52% -0.62% 6 04-Sep-00 39.64 129.19 69.31 7.20%% -J.14% -1.25% 7 11-Sep-00 40. 10 124.70 64.19 1.14% -3.54% -7.68% 18-Sep-00 37.44 123.58 63.25 6.86% -0.90% -1.47% 9 25-Sep-00 42 32 112.35 60.31 12.25%% -9.52%% 4.76% 10 02-Oct-00 40.37 115.72 55.56 4.72% 2.95% -8.20% 11 09-Oct-00 42.00 108.80 53.75 3.97% -6.17% -3.32% 12 16-0ct-00 42.59 94.52 65.19 1.39% -14.07% 19.29 13 23-Oct-00 40.95 93.46 67.69 -3.91% -1.13% 3.76% 14 30-Oct-00 41.97 99_8 8 68.25 2.45% 6.65% 0.83% 15 06-Nov-00 43.17 92 89 67.38 2.83%% -7.25% -1.29% 16 13-Nov-00 43.83 101.82 69.06 1.51% 9.18% 2.47% 17 20-Nov-00 42.71 99.82 69 94 -2.58% -1.98% 1.26% 18 27-Nov-00 43.33 95.52 56.63 1.44%% -4.41% -21.12% 19 04-Dec-00 42.59 96 89 54.44 -1.73% 1.43%% -3.94% 20 11-Dec-00 41.06 87.71 49.19 -3.64% -9.95% -10.14%% 21 18-Dec-00 41.96 88 90 46.44 2.17%% 1.34% -5.75% 12 25-Dec-00 36.25 93.89 49.13 -14.63% 5.47% 5.63% 23 01-Jan-01 41.10 84.72 43.38 12.54%% -10.29% -12.45% 24 08-Jan-01 34.83 93.71 53.50 -16.55% 10.09% 20.98% 25 15-Jan-01 36.16 111.12 61.00 3.76% 17.05% 13.12% 26 22-Jan-01 38.24 114.06 64.00 5.59% 2.61%% 4.80% 27 29-Jm-01 37.33 110.14 60.81 -2.42% -3.49% -5.11%% 28 05-Feb-01 41.02 112.00 59.13 9.44% 1.67% -2.81% 29 12-Feb-01 41.16 115.00 57.31 0.34% 2.64% -3.11% 30 19-Feb-01 42 27 108.90 55.19 2.66% -5.45%% -3.78% Weekly Sigma of Returns 6.34% 6.69% 8.26% Annualized standard deviation of returns 45.75% 48.24%% 59.56%CADIOR & ITO'S DILEMMA Option Premium and Market Data for February 20, 2001 + Call Premiums Put Premiums Mar Apr July Mar Apr July Duke Energy 42.27 40 4.30 5.30 0,75 1.30 2.25 42.27 42.5 2.70 3.90 4.80 2.40 42.27 45 1.25 2.40 3.30 IBM 108.90 100 12.00 14.10 18.70 2.20 4,30 7.00 108.90 110 4,40 8.10 11.40 5.30 8.10 10.50 108,90 120 1.10 3.60 7.50 12.20 13.90 15.60 Microsoft 55.19 50 6.50 8.13 10.00 1.19 2.50 4.00 55.19 55 3.00 4.50 6.88 2.69 4.13 6.00 55.19 60 0.94 2.38 4.50 5.38 6.75 8.13 T-bill rates 4.92% 4.85% 4.91% 4.92% 4.85% 4.91% Expiration date 17-Mar 21-Apr 21-Jul 17-Mar 21-Apr 21-Jul Days to expiration 25 60 151 25 60 151