Answered step by step
Verified Expert Solution
Question
1 Approved Answer
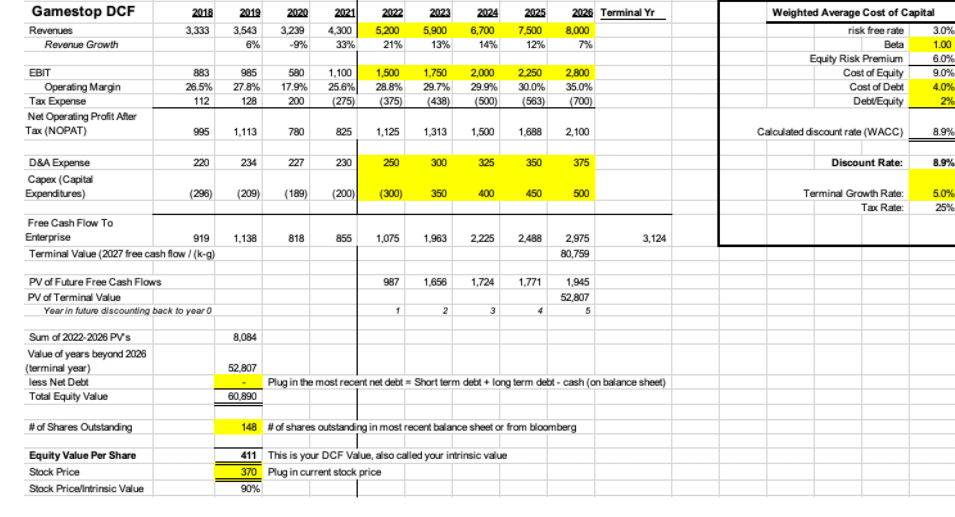
Does this company have a good capex? and why? Gamestop DCF Revenues Revenue Growth 2018 3,333 2019 3.543 6% 2020 3,239 -9% 2021 4,300 33%

Does this company have a good capex? and why?
Gamestop DCF Revenues Revenue Growth 2018 3,333 2019 3.543 6% 2020 3,239 -9% 2021 4,300 33% 2022 5,200 21% 2023 5.900 13% 2024 6,700 14% 2025 7,500 12% 2026 Terminal Yr 8,000 7% Weighted Average Cost of Capital risk free rate 3.0% Beta 1.00 Equity Risk Premium 6.0% Cost of Equity 9.0% Cost of Debt 4.0% DeblEquity 2% EBIT Operating Margin Tax Expense Net Operating Profit After Tax (NOPAT) 883 26.5% 112 985 27.8% 128 580 17.9% 200 1,100 25.6% (275) 1,500 28.8% (375) 1,750 29.7% (438) 2.000 29.9% (500) 2250 30.0% (563) 2,800 35.0% (700) 995 1,113 780 825 1.125 1,313 1,500 1,688 2,100 Calculated discount rate (WACC) 8.9% 220 234 227 230 250 300 325 350 375 Discount Rate: 8.9% D&A Expense Capex (Capital Expenditures) (296) (209) (189) (200) (300) 350 400 450 500 Terminal Growth Rate: Tax Rate: 5.0% 25% 919 1,138 818 855 1,075 1,963 2.225 2.488 3,124 2,975 80,759 987 1.656 1.724 1,771 Free Cash Flow To Enterprise Terminal Value (2027 free cash flow /(kg) PV of Future Free Cash Flows PV of Terminal Value Year in future discounting back to your Sum of 2022-2026 PV's Value of years beyond 2026 (terminal year) less Net Debt Total Equity Value 1,945 52,807 5 1 2 3 4 8,084 52,807 Plug in the most recent net debt = Short term debt + long term debt-cash (on balance sheet) 60,890 # of Shares Outstanding Equity Value Per Share Stock Price Stock Pricelintrinsic Value 148 #of shares outstanding in most recent balance sheet or from bloomberg 411 This is your DCF Value, also called your intrinsic value 370 Plugin current stock price 90% Gamestop DCF Revenues Revenue Growth 2018 3,333 2019 3.543 6% 2020 3,239 -9% 2021 4,300 33% 2022 5,200 21% 2023 5.900 13% 2024 6,700 14% 2025 7,500 12% 2026 Terminal Yr 8,000 7% Weighted Average Cost of Capital risk free rate 3.0% Beta 1.00 Equity Risk Premium 6.0% Cost of Equity 9.0% Cost of Debt 4.0% DeblEquity 2% EBIT Operating Margin Tax Expense Net Operating Profit After Tax (NOPAT) 883 26.5% 112 985 27.8% 128 580 17.9% 200 1,100 25.6% (275) 1,500 28.8% (375) 1,750 29.7% (438) 2.000 29.9% (500) 2250 30.0% (563) 2,800 35.0% (700) 995 1,113 780 825 1.125 1,313 1,500 1,688 2,100 Calculated discount rate (WACC) 8.9% 220 234 227 230 250 300 325 350 375 Discount Rate: 8.9% D&A Expense Capex (Capital Expenditures) (296) (209) (189) (200) (300) 350 400 450 500 Terminal Growth Rate: Tax Rate: 5.0% 25% 919 1,138 818 855 1,075 1,963 2.225 2.488 3,124 2,975 80,759 987 1.656 1.724 1,771 Free Cash Flow To Enterprise Terminal Value (2027 free cash flow /(kg) PV of Future Free Cash Flows PV of Terminal Value Year in future discounting back to your Sum of 2022-2026 PV's Value of years beyond 2026 (terminal year) less Net Debt Total Equity Value 1,945 52,807 5 1 2 3 4 8,084 52,807 Plug in the most recent net debt = Short term debt + long term debt-cash (on balance sheet) 60,890 # of Shares Outstanding Equity Value Per Share Stock Price Stock Pricelintrinsic Value 148 #of shares outstanding in most recent balance sheet or from bloomberg 411 This is your DCF Value, also called your intrinsic value 370 Plugin current stock price 90%Step by Step Solution
There are 3 Steps involved in it
Step: 1

Get Instant Access to Expert-Tailored Solutions
See step-by-step solutions with expert insights and AI powered tools for academic success
Step: 2

Step: 3

Ace Your Homework with AI
Get the answers you need in no time with our AI-driven, step-by-step assistance
Get Started


