 DOLLAR GENERAL BALANCE SHEET
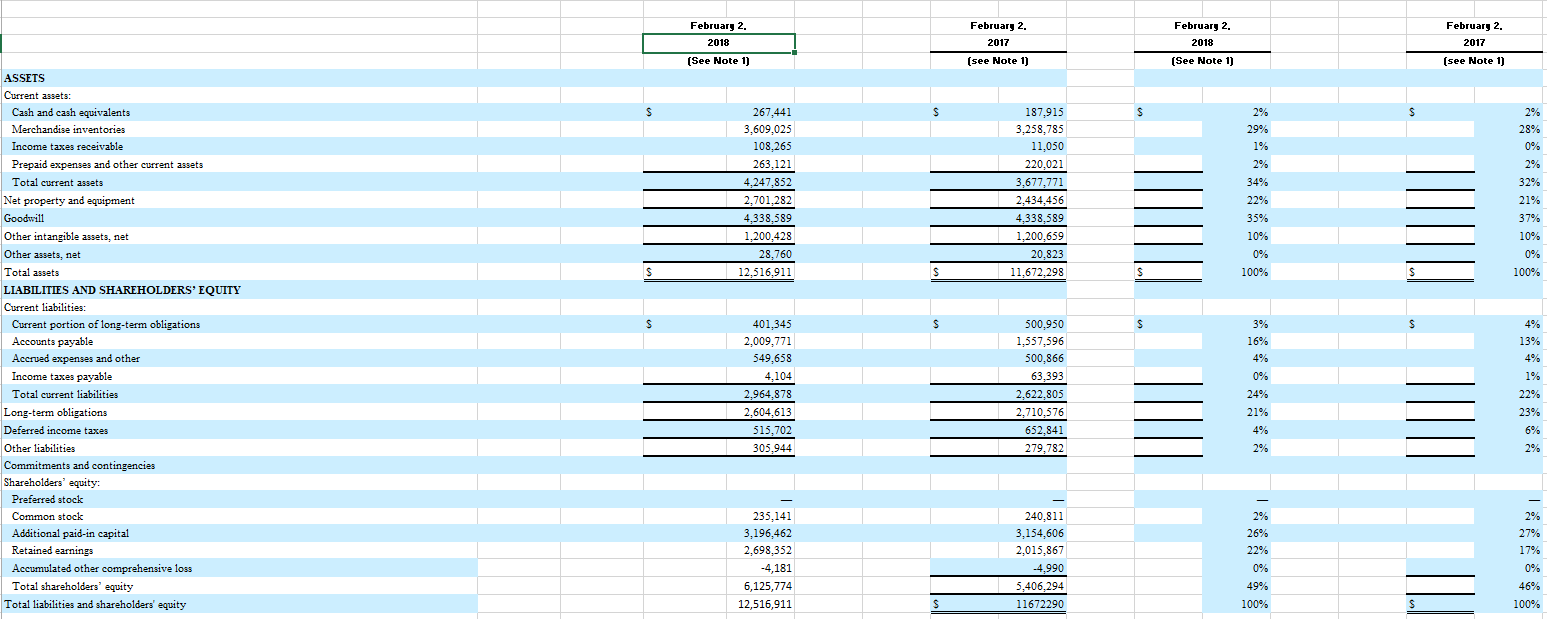
 Solve for the ratios of both companies. Pretend that 2018 is 2015 and 2017 is 2014
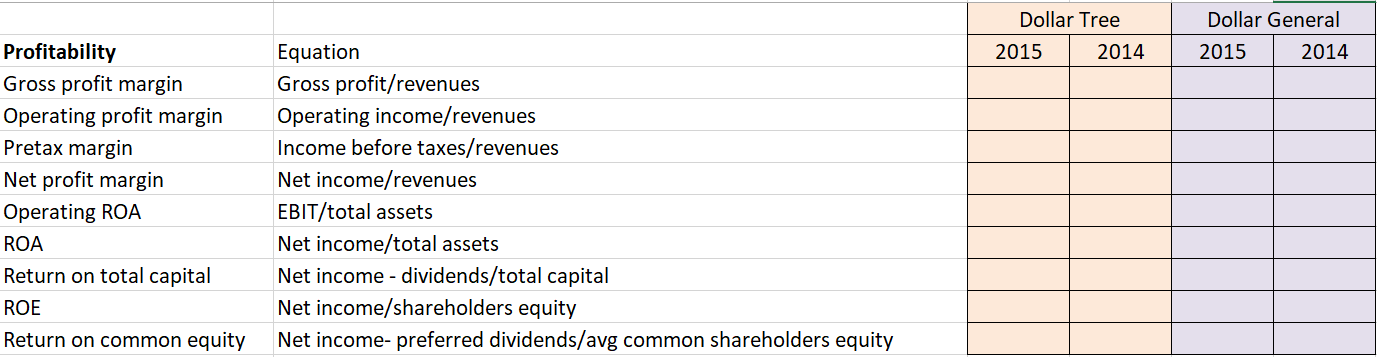
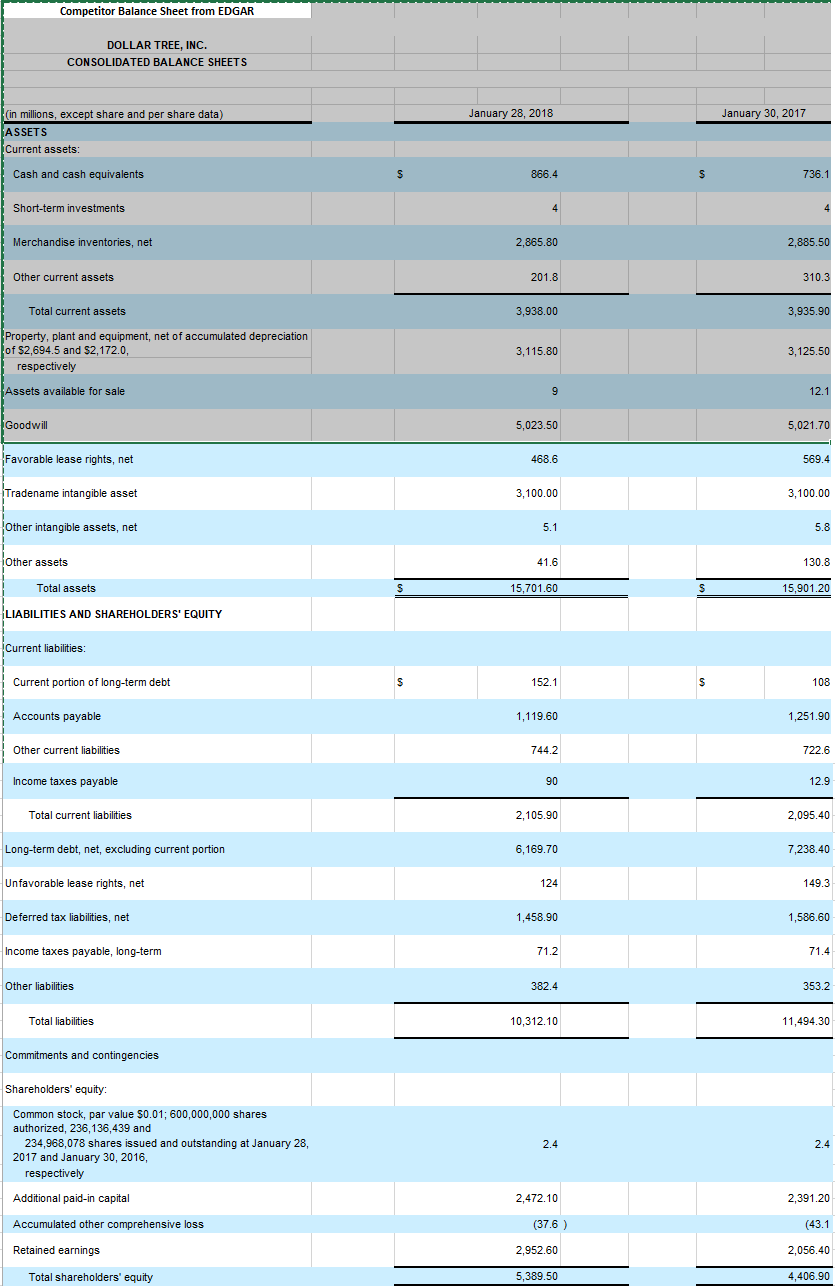
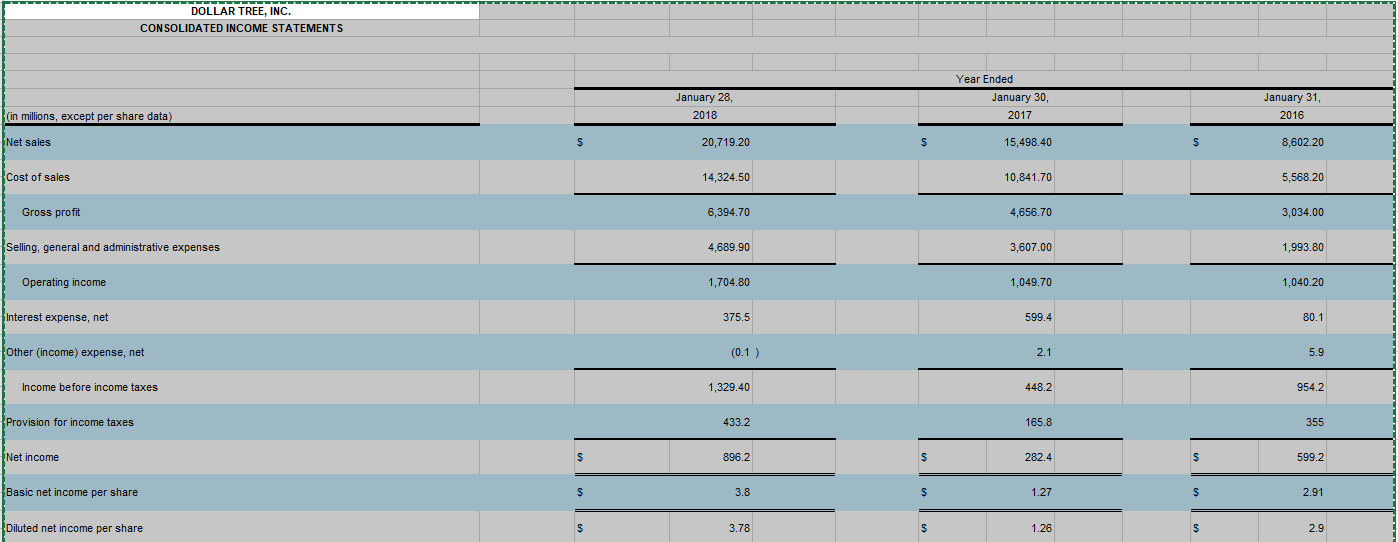
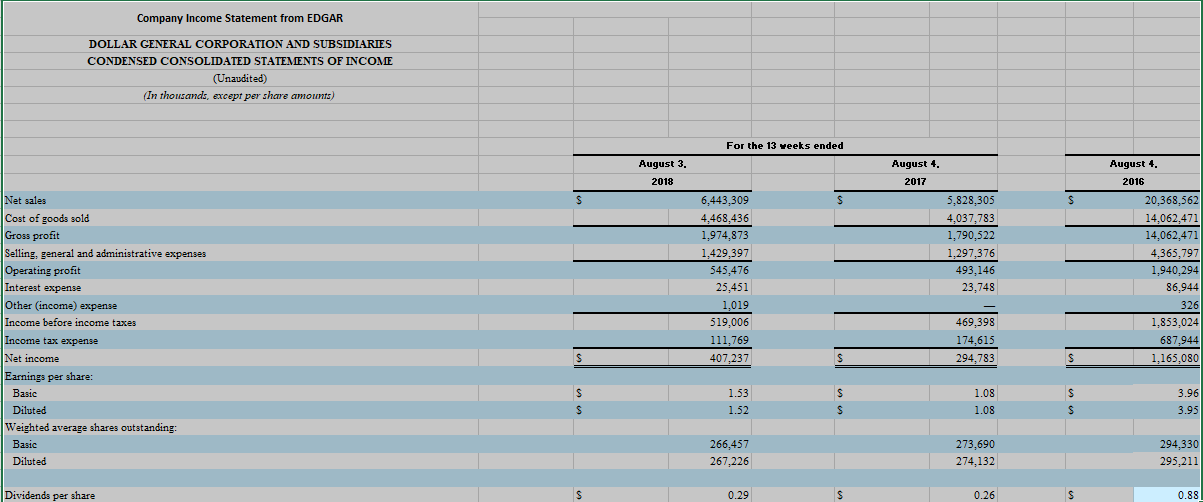
Competitor Balance Sheet from EDGAR DOLLAR TREE, INC. CONSOLIDATED BALANCE SHEETS January 28, 2018 January 30, 2017 (in millions, except share and per share data) ASSETS Current assets: Cash and cash equivalents 866.4 S 736.1 Short-term investments Merchandise inventories, net 2,865.80 2,885.50 Other current assets 201.8 310.3 Total current assets 3,938.00 3,935.90 Property, plant and equipment, net of accumulated depreciation of $2,694.5 and $2,172.0, respectively 3,115.80 3,125.50 Assets available for sale 12.1 Goodwill 5,023.50 5,021.70 Favorable lease rights, net 468.6 569.4 Tradename intangible asset 3,100.00 3,100.00 Other intangible assets, net 5.1 5.8 Other assets 41.6 130.8 Total assets 15,701.60 15,901.20 LIABILITIES AND SHAREHOLDERS' EQUITY Current liabilities: Current portion of long-term debt 152.1 108 Accounts payable 1,119.60 1,251.90 Other current liabilities 744.2 722.6 Income taxes payable 90 12.9 Total current liabilities 2,105.90 2,095.40 Long-term debt, net, excluding current portion 6,169.70 7,238.40 Unfavorable lease rights, net 124 149.3 Deferred tax liabilities, net 1,458.90 1,586.60 Income taxes payable, long-term 71.2 71.4 Other liabilities 382.4 353.2 Total liabilities 10,312.10 11,494.30 Commitments and contingencies Shareholders' equity: Common stock, par value $0.01; 600,000,000 shares authorized, 236,136,439 and 234,968,078 shares issued and outstanding at January 28, 2017 and January 30, 2016, respectively Additional paid-in capital 2,472.10 2,391.20 Accumulated other comprehensive loss (37.6) (43.1 Retained earnings 2,952.60 2,056.40 Total shareholders' equity 5,389.50 4,406.90 February 2. February 2. 2018 (See Note 1) February 2. 2017 (see Note 1) February 2. 2017 2018 (See Note 1) (see Note 1) 2% 2% 267,441 3,609,025 108,265 263,121 4.247.852 2.701,282 4,338,589 1.200,428 28,760 12,516,911 - - 187,915 3,258,785 11,050 220.021 3,677,771 2.434.456 4,338,589 1,200,659 20,823 11,672,298 29% 1% 2% 34% 22% 35% 10% 0% 100% 10% 0% 100% ASSETS Current assets: Cash and cash equivalents Merchandise inventories Income taxes receivable Prepaid expenses and other current assets Total current assets Net property and equipment Goodwill Other intangible assets, net Other assets, net Total assets LIABILITIES AND SHAREHOLDERS' EQUITY Current liabilities: Current portion of long-term obligations Accounts payable Accrued expenses and other Income taxes payable Total current liabilities Long-term obligations Deferred income taxes Other liabilities Commitments and contingencies Shareholders' equity: Preferred stock Common stock Additional paid-in capital Retained earnings Accumulated other comprehensive loss Total shareholders' equity Total liabilities and shareholders' equity - - - - - - - - - - - - - - 4% 13% 401,345 2,009,771 549,658 4.104 2.964,878 2,604,613 515,702 305,944 500,950 1,557,596 500.866 63,393 2,622,805 2,710,576 652,841 279,782 3% 16% 4% 0% 24% 21% - - 17% 235,141 3,196,462 2,698,352 -4,181 6,125,774 12,516,911 240,811 3,154,606 2,015,867 -4,990 5,406,294 11672290 2% 26% 22% 0% 49% 100% 46% 100% DOUTAB TEFFIC----------------- CONSOLIDATED INCOME STATEMENTS January 28, 2018 Year Ended January 30, 2017 January 31, 2016 (in millions, except per share data) Net sales $ 20,719.20 15,498.40 8,602.20 Cost of sales 14,324.50 10,841.70 5,568.20 Gross profit 6,394.70 4,656.70 3,034.00 Selling, general and administrative expenses 4,689.90 3,607.00 1,993.80 Operating income 1,704.80 1,049.70 1,040.20 Interest expense, net 375.5 599.4 80.1 Other (income) expense, net (0.1) 2.1 5.9 Income before income taxes 1,329.40 448.2 954.2 Provision for income taxes 433.2 165.8 355 Net income 896.2 282.4 599.2 Basic net income per share 3.8 - 1.27 2.91 Diluted net income per share 3.78 1.26 2.9 Company Income Statement from EDGAR DOLLAR GENERAL CORPORATION AND SUBSIDIARIES CONDENSED CONSOLIDATED STATEMENTS OF INCOME (Unaudited) (In thousands, except per share amounts) August 4. 2017 For the 13 weeks ended August 3, 2018 6,443,309 $ 4,468,436 1,974.873 1,429,397 545,476 25,451 1,019 519,006 111,769 407,237 $ Net sales Cost of goods sold Gross profit Selling, general and administrative expenses Operating profit Interest expense Other (income) expense Income before income taxes Income tax expense Net income Earnings per share: Basic Diluted Weighted average shares outstanding: Basic Diluted 5,828,305 4,037,783 1,790,522 1,297,376 493,146 23,748 August 4 2016 20,368,562 14,062,471 14,062,471 4,365,797 1,940,294 86,944 326 1,853,024 687,944 1 ,165,080 469,398 174,615 294,783 S S 1.53 1.52 1.08 1.08 3.96 3.95 266,457 267.226 273,690 274,132 294,330 295,211 Dividends per share 0.29 0.26 $ 0.88 Dollar Tree 2015 2014 Dollar General 2015 2014 Profitability Gross profit margin Operating profit margin Pretax margin Net profit margin Operating ROA ROA Return on total capital ROE Return on common equity Equation Gross profit/revenues Operating income/revenues Income before taxes/revenues Net income/revenues EBIT/total assets Net income/total assets Net income - dividends/total capital Net income/shareholders equity Net income-preferred dividends/avg common shareholders equity Competitor Balance Sheet from EDGAR DOLLAR TREE, INC. CONSOLIDATED BALANCE SHEETS January 28, 2018 January 30, 2017 (in millions, except share and per share data) ASSETS Current assets: Cash and cash equivalents 866.4 S 736.1 Short-term investments Merchandise inventories, net 2,865.80 2,885.50 Other current assets 201.8 310.3 Total current assets 3,938.00 3,935.90 Property, plant and equipment, net of accumulated depreciation of $2,694.5 and $2,172.0, respectively 3,115.80 3,125.50 Assets available for sale 12.1 Goodwill 5,023.50 5,021.70 Favorable lease rights, net 468.6 569.4 Tradename intangible asset 3,100.00 3,100.00 Other intangible assets, net 5.1 5.8 Other assets 41.6 130.8 Total assets 15,701.60 15,901.20 LIABILITIES AND SHAREHOLDERS' EQUITY Current liabilities: Current portion of long-term debt 152.1 108 Accounts payable 1,119.60 1,251.90 Other current liabilities 744.2 722.6 Income taxes payable 90 12.9 Total current liabilities 2,105.90 2,095.40 Long-term debt, net, excluding current portion 6,169.70 7,238.40 Unfavorable lease rights, net 124 149.3 Deferred tax liabilities, net 1,458.90 1,586.60 Income taxes payable, long-term 71.2 71.4 Other liabilities 382.4 353.2 Total liabilities 10,312.10 11,494.30 Commitments and contingencies Shareholders' equity: Common stock, par value $0.01; 600,000,000 shares authorized, 236,136,439 and 234,968,078 shares issued and outstanding at January 28, 2017 and January 30, 2016, respectively Additional paid-in capital 2,472.10 2,391.20 Accumulated other comprehensive loss (37.6) (43.1 Retained earnings 2,952.60 2,056.40 Total shareholders' equity 5,389.50 4,406.90 February 2. February 2. 2018 (See Note 1) February 2. 2017 (see Note 1) February 2. 2017 2018 (See Note 1) (see Note 1) 2% 2% 267,441 3,609,025 108,265 263,121 4.247.852 2.701,282 4,338,589 1.200,428 28,760 12,516,911 - - 187,915 3,258,785 11,050 220.021 3,677,771 2.434.456 4,338,589 1,200,659 20,823 11,672,298 29% 1% 2% 34% 22% 35% 10% 0% 100% 10% 0% 100% ASSETS Current assets: Cash and cash equivalents Merchandise inventories Income taxes receivable Prepaid expenses and other current assets Total current assets Net property and equipment Goodwill Other intangible assets, net Other assets, net Total assets LIABILITIES AND SHAREHOLDERS' EQUITY Current liabilities: Current portion of long-term obligations Accounts payable Accrued expenses and other Income taxes payable Total current liabilities Long-term obligations Deferred income taxes Other liabilities Commitments and contingencies Shareholders' equity: Preferred stock Common stock Additional paid-in capital Retained earnings Accumulated other comprehensive loss Total shareholders' equity Total liabilities and shareholders' equity - - - - - - - - - - - - - - 4% 13% 401,345 2,009,771 549,658 4.104 2.964,878 2,604,613 515,702 305,944 500,950 1,557,596 500.866 63,393 2,622,805 2,710,576 652,841 279,782 3% 16% 4% 0% 24% 21% - - 17% 235,141 3,196,462 2,698,352 -4,181 6,125,774 12,516,911 240,811 3,154,606 2,015,867 -4,990 5,406,294 11672290 2% 26% 22% 0% 49% 100% 46% 100% DOUTAB TEFFIC----------------- CONSOLIDATED INCOME STATEMENTS January 28, 2018 Year Ended January 30, 2017 January 31, 2016 (in millions, except per share data) Net sales $ 20,719.20 15,498.40 8,602.20 Cost of sales 14,324.50 10,841.70 5,568.20 Gross profit 6,394.70 4,656.70 3,034.00 Selling, general and administrative expenses 4,689.90 3,607.00 1,993.80 Operating income 1,704.80 1,049.70 1,040.20 Interest expense, net 375.5 599.4 80.1 Other (income) expense, net (0.1) 2.1 5.9 Income before income taxes 1,329.40 448.2 954.2 Provision for income taxes 433.2 165.8 355 Net income 896.2 282.4 599.2 Basic net income per share 3.8 - 1.27 2.91 Diluted net income per share 3.78 1.26 2.9 Company Income Statement from EDGAR DOLLAR GENERAL CORPORATION AND SUBSIDIARIES CONDENSED CONSOLIDATED STATEMENTS OF INCOME (Unaudited) (In thousands, except per share amounts) August 4. 2017 For the 13 weeks ended August 3, 2018 6,443,309 $ 4,468,436 1,974.873 1,429,397 545,476 25,451 1,019 519,006 111,769 407,237 $ Net sales Cost of goods sold Gross profit Selling, general and administrative expenses Operating profit Interest expense Other (income) expense Income before income taxes Income tax expense Net income Earnings per share: Basic Diluted Weighted average shares outstanding: Basic Diluted 5,828,305 4,037,783 1,790,522 1,297,376 493,146 23,748 August 4 2016 20,368,562 14,062,471 14,062,471 4,365,797 1,940,294 86,944 326 1,853,024 687,944 1 ,165,080 469,398 174,615 294,783 S S 1.53 1.52 1.08 1.08 3.96 3.95 266,457 267.226 273,690 274,132 294,330 295,211 Dividends per share 0.29 0.26 $ 0.88 Dollar Tree 2015 2014 Dollar General 2015 2014 Profitability Gross profit margin Operating profit margin Pretax margin Net profit margin Operating ROA ROA Return on total capital ROE Return on common equity Equation Gross profit/revenues Operating income/revenues Income before taxes/revenues Net income/revenues EBIT/total assets Net income/total assets Net income - dividends/total capital Net income/shareholders equity Net income-preferred dividends/avg common shareholders equity