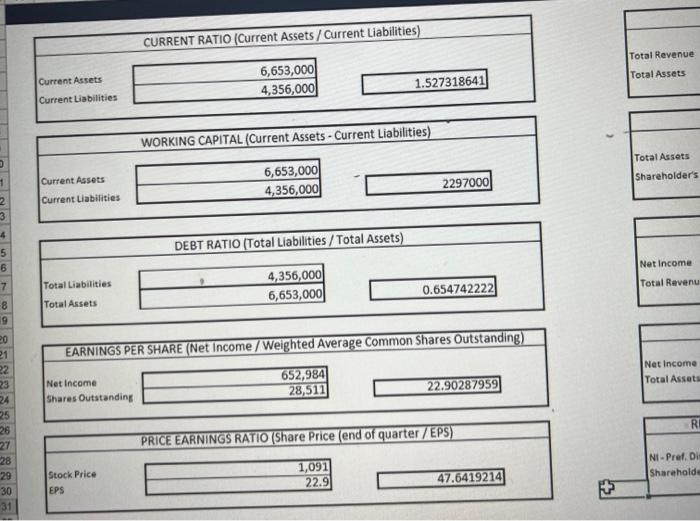
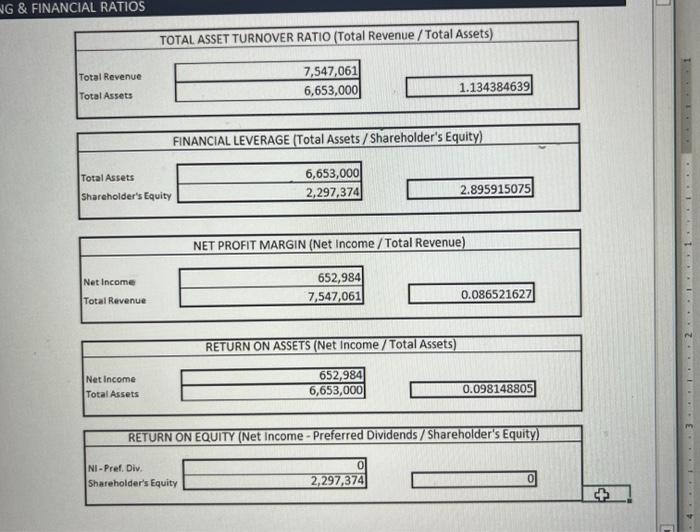
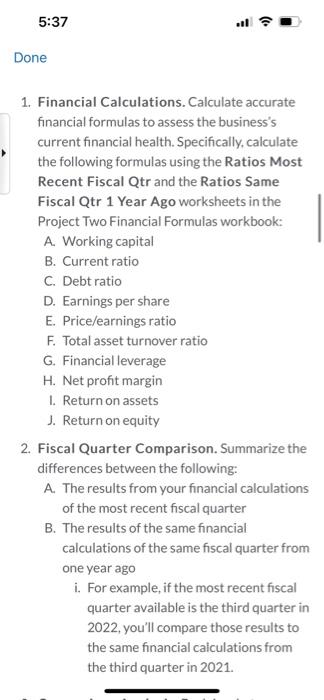
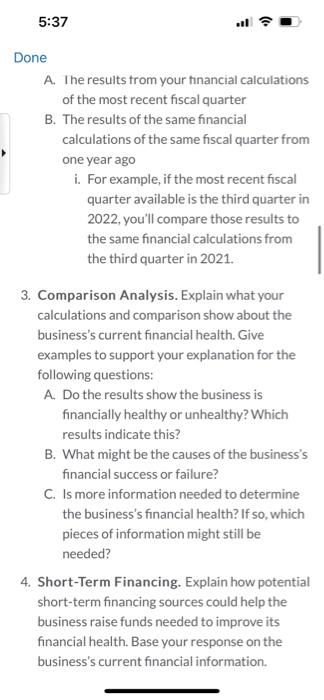
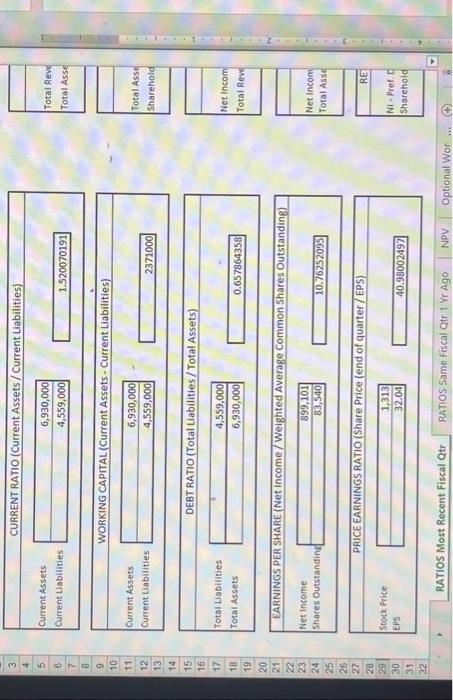
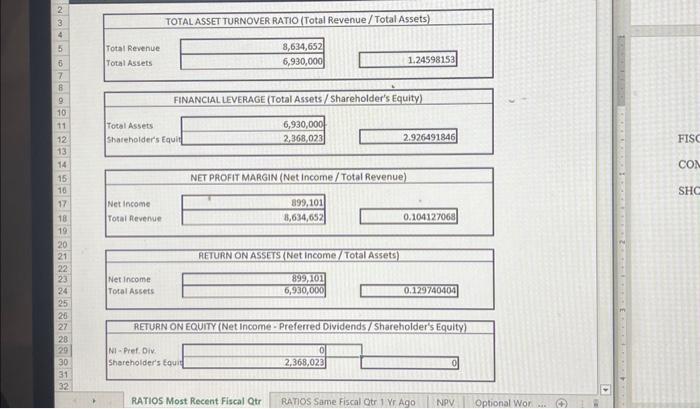
Done A. The results trom your tinancial calculations of the most recent fiscal quarter B. The results of the same financial calculations of the same fiscal quarter from one year ago i. For example, if the most recent fiscal quarter available is the third quarter in 2022, you'll compare those results to the same financial calculations from the third quarter in 2021. 3. Comparison Analysis. Explain what your calculations and comparison show about the business's current financial health. Give examples to support your explanation for the following questions: A. Do the results show the business is financially healthy or unhealthy? Which results indicate this? B. What might be the causes of the business's financial success or failure? C. Is more information needed to determine the business's financial health? If so, which pieces of information might still be needed? 4. Short-Term Financing. Explain how potential short-term financing sources could help the business raise funds needed to improve its financial health. Base your response on the business's current financial information. \& FINANCIAL RATIOS \begin{tabular}{|l|r|} \hline \multicolumn{2}{|c|}{ TOTAL ASSET TURNOVER RATIO (Total Revenue / Total Assets) } \\ \hline \multirow{2}{*}{TotalRevenueTotalAssets} & 7,547,061 \\ \hline \end{tabular} \begin{tabular}{|l|r|} \hline \multicolumn{2}{|c|}{ FINANCIAL LEVERAGE (Total Assets / Shareholder's Equity) } \\ \hline \multirow{2}{*}{TotalAssetsShareholdersEquity} & 6,653,000 \\ \cline { 2 - 3 } & 2,297,374 \\ \hline \end{tabular} NET PROFIT MARGIN (Net income / Total Revenue) Net Income Total Revenue \begin{tabular}{|r|} \hline 652,984 \\ \hline 7,547,061 \\ \hline \end{tabular} 0.086521627 1. Financial Calculations. Calculate accurate financial formulas to assess the business's current financial health. Specifically, calculate the following formulas using the Ratios Most Recent Fiscal Qtr and the Ratios Same Fiscal Qtr 1 Year Ago worksheets in the Project Two Financial Formulas workbook: A. Working capital B. Currentratio C. Debt ratio D. Earnings per share E. Price/earnings ratio F. Total asset turnover ratio G. Financial leverage H. Net profit margin I. Return on assets J. Return on equity 2. Fiscal Quarter Comparison. Summarize the differences between the following: A. The results from your financial calculations of the most recent fiscal quarter B. The results of the same financial calculations of the same fiscal quarter from one year ago i. For example, if the most recent fiscal quarter available is the third quarter in 2022, you'll compare those results to the same financial caiculations from the third quarter in 2021. \begin{tabular}{|l|} \hline 2 \\ \hline 3 \\ \hline 4 \\ \hline 5 \\ \hline 6 \\ \hline 7 \\ \hline 8 \\ \hline 9 \\ \hline 10 \\ \hline 11 \\ \hline 12 \\ \hline 13 \\ \hline 14 \\ \hline 15 \\ \hline 16 \\ \hline 17 \\ \hline 18 \\ \hline 19 \\ \hline 20 \\ \hline 21 \\ \hline 22 \\ \hline 23 \\ \hline 24 \\ \hline 25 \\ \hline 26 \\ \hline 27 \\ \hline 28 \\ \hline 29 \\ \hline 30 \\ \hline 31 \\ \hline 32 \\ \hline \end{tabular} FINANCIAL LEVERAGE (Total Assets / Shareholder's Equity) Total Assets Shareholder's Equit 6,930,0002,368,023 2.926491846 NET PROFIT MARGIN (Net income/Total Revenue) Net income Total Revenue. \begin{tabular}{|r|} \hline 1899,101 \\ \hline 8,634,652 \\ \hline \end{tabular} 0.104127068 RETURN ONASSEIS (Net income/Total Assets) Net income TotalAssets 0.129740404 RETURN ON EQUITY (Net income-Preferred Dividends/Shareholder's Equity) Ni-Pret, Div. Shereholder's tauit \begin{tabular}{r|r} 2,368,023 \\ \hline \end{tabular} 0 Done A. The results trom your tinancial calculations of the most recent fiscal quarter B. The results of the same financial calculations of the same fiscal quarter from one year ago i. For example, if the most recent fiscal quarter available is the third quarter in 2022, you'll compare those results to the same financial calculations from the third quarter in 2021. 3. Comparison Analysis. Explain what your calculations and comparison show about the business's current financial health. Give examples to support your explanation for the following questions: A. Do the results show the business is financially healthy or unhealthy? Which results indicate this? B. What might be the causes of the business's financial success or failure? C. Is more information needed to determine the business's financial health? If so, which pieces of information might still be needed? 4. Short-Term Financing. Explain how potential short-term financing sources could help the business raise funds needed to improve its financial health. Base your response on the business's current financial information. \& FINANCIAL RATIOS \begin{tabular}{|l|r|} \hline \multicolumn{2}{|c|}{ TOTAL ASSET TURNOVER RATIO (Total Revenue / Total Assets) } \\ \hline \multirow{2}{*}{TotalRevenueTotalAssets} & 7,547,061 \\ \hline \end{tabular} \begin{tabular}{|l|r|} \hline \multicolumn{2}{|c|}{ FINANCIAL LEVERAGE (Total Assets / Shareholder's Equity) } \\ \hline \multirow{2}{*}{TotalAssetsShareholdersEquity} & 6,653,000 \\ \cline { 2 - 3 } & 2,297,374 \\ \hline \end{tabular} NET PROFIT MARGIN (Net income / Total Revenue) Net Income Total Revenue \begin{tabular}{|r|} \hline 652,984 \\ \hline 7,547,061 \\ \hline \end{tabular} 0.086521627 1. Financial Calculations. Calculate accurate financial formulas to assess the business's current financial health. Specifically, calculate the following formulas using the Ratios Most Recent Fiscal Qtr and the Ratios Same Fiscal Qtr 1 Year Ago worksheets in the Project Two Financial Formulas workbook: A. Working capital B. Currentratio C. Debt ratio D. Earnings per share E. Price/earnings ratio F. Total asset turnover ratio G. Financial leverage H. Net profit margin I. Return on assets J. Return on equity 2. Fiscal Quarter Comparison. Summarize the differences between the following: A. The results from your financial calculations of the most recent fiscal quarter B. The results of the same financial calculations of the same fiscal quarter from one year ago i. For example, if the most recent fiscal quarter available is the third quarter in 2022, you'll compare those results to the same financial caiculations from the third quarter in 2021. \begin{tabular}{|l|} \hline 2 \\ \hline 3 \\ \hline 4 \\ \hline 5 \\ \hline 6 \\ \hline 7 \\ \hline 8 \\ \hline 9 \\ \hline 10 \\ \hline 11 \\ \hline 12 \\ \hline 13 \\ \hline 14 \\ \hline 15 \\ \hline 16 \\ \hline 17 \\ \hline 18 \\ \hline 19 \\ \hline 20 \\ \hline 21 \\ \hline 22 \\ \hline 23 \\ \hline 24 \\ \hline 25 \\ \hline 26 \\ \hline 27 \\ \hline 28 \\ \hline 29 \\ \hline 30 \\ \hline 31 \\ \hline 32 \\ \hline \end{tabular} FINANCIAL LEVERAGE (Total Assets / Shareholder's Equity) Total Assets Shareholder's Equit 6,930,0002,368,023 2.926491846 NET PROFIT MARGIN (Net income/Total Revenue) Net income Total Revenue. \begin{tabular}{|r|} \hline 1899,101 \\ \hline 8,634,652 \\ \hline \end{tabular} 0.104127068 RETURN ONASSEIS (Net income/Total Assets) Net income TotalAssets 0.129740404 RETURN ON EQUITY (Net income-Preferred Dividends/Shareholder's Equity) Ni-Pret, Div. Shereholder's tauit \begin{tabular}{r|r} 2,368,023 \\ \hline \end{tabular} 0
