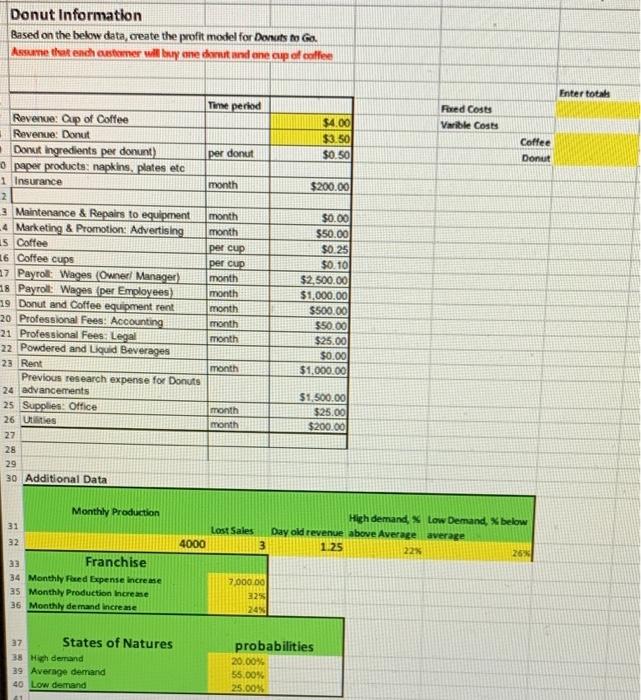
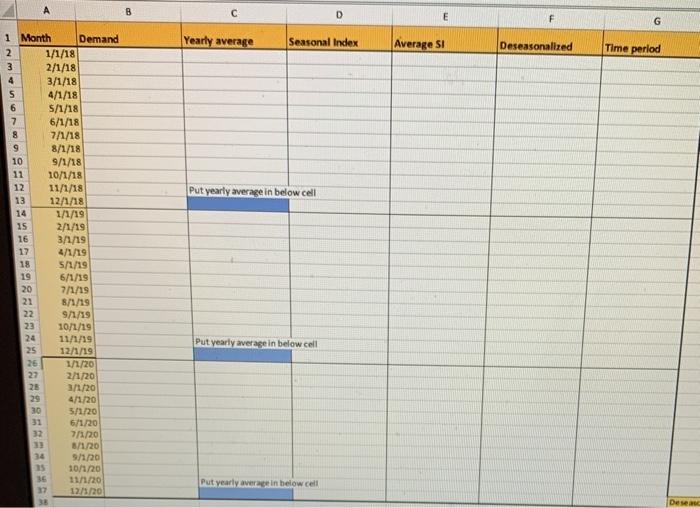
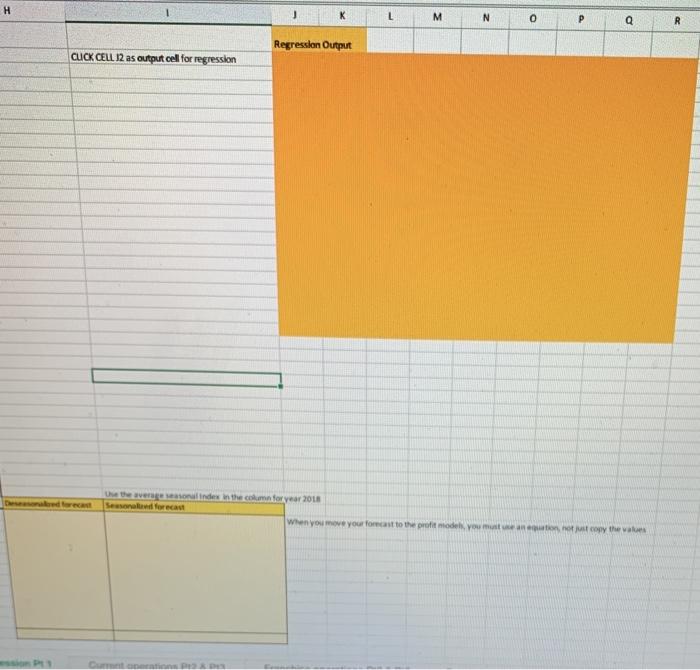
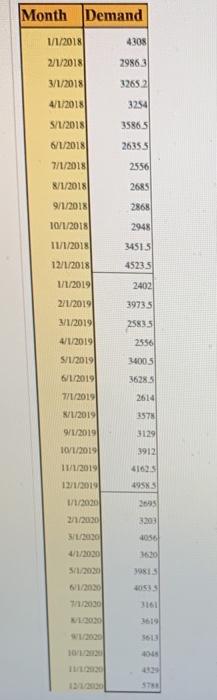
Donut Information Based on the below data, create the profit model for Donuts to Go. Assume that ench customer will buy one dotandone cup of coffee Enter total Foxed Costs Vaible Costa $4.00 $3.50 $0.50 Coffee Donut $200.00 Time period Reverse: Cup of Coffee Revente: Donut Donut Ingredients per donunt) per donut 0 paper products: napkins, plates etc 1 Insurance month 2 3 Maintenance & Repairs to equipment month -4 Marketing & Promotion: Advertising month 15 Coffee per cup 16 Coffee cups per cup 17 Payroll: Wages (Owner Manager) month 18 Payroll: Wages (per Employees) month 19 Donut and Coffee equipment rent month 20 Professional Fees: Accounting month 21 Professional Fees: Legal month 22 Powdered and Liquid Beverages 23 Rent month Previous research expense for Donuts 24 advancements 25 Supplies Office month 26 Utilities month 27 28 29 30 Additional Data $0.00 $50.00 $0.25 $0.10 $2,500.00 $1,000.00 $500.00 $50.00 $25.00 $0.00 $1,000.00 $1,500.00 $25.00 $200.00 Monthly Production 31 32 High demand, Low Demand, below Lost Sales Day old revenue above average average 4000 3 1.25 22% 26% 33 Franchise 34 Monthly Fed Expense increme 35 Monthly Production Increase 36 Monthly demand increase 7.000.00 321 24% 37 States of Natures 38 Hich demand 39 Average demand 40 Low demand probabilities 20.00% 55.00% 25.00% B D E F G Yearly average Seasonal Index Average SI Deseasonalized Time period Put yearly average in below cell 1 Month Demand 2 1/1/18 3 2/1/18 4 3/1/18 S 4/1/18 6 5/1/18 7 6/1/18 8 7/1/18 9 8/1/18 10 9/1/18 11 10/1/18 12 11/1/18 13 12/1/18 14 1/1/19 15 2/1/19 16 32/19 17 4/1/19 18 S/1/19 19 6/1/19 20 7/1/19 21 8/1/19 22 9/1/15 23 10/1/19 24 11/1/19 25 12/1/19 26 1/1/20 27 2/1/20 28 3./20 29 4/1/20 30 5/1/20 31 6/1/20 32 7/1/20 B/120 9/1/20 15 10/1/20 11/1/20 17 12/120 Put yearly average in below cell Put yearly average in below cell Desa H K M N 0 2 Regression Output CLICK CELL 12 as output cell for regression We the average ander in the comfor year 2018 When you move your forecast to the profit models, you mutation hout copy the wa D Month Demand 1/1/2018 4308 2/1/2018 29863 3/1/2018 32652 4/1/2018 PSTE S/1/2018 S 98SE 6/1/2018 26355 7/1/2018 2556 8/1/2018 2685 9/1/2018 2868 2948 10/1/2018 11/1/2018 34515 12/1/2018 45235 1/1/2019 2402 39735 2/1/20191 1/1/20191 25835 4/1/2019 2556 1400 5 5/1/2019 6/1/2019 36283 7/1/2019 2614 /1/2019 3575 3129 9/1/2019 10/1/2019 3912 41625 11/1/20191 12/1/2019 19583 1/1/2020 21/2020 265 3203 3/20 4056 16.30 4/1/2020 3/1/2020 1981 7/2000 3613 10 uror 13300 ST Donut Information Based on the below data, create the profit model for Donuts to Go. Assume that ench customer will buy one dotandone cup of coffee Enter total Foxed Costs Vaible Costa $4.00 $3.50 $0.50 Coffee Donut $200.00 Time period Reverse: Cup of Coffee Revente: Donut Donut Ingredients per donunt) per donut 0 paper products: napkins, plates etc 1 Insurance month 2 3 Maintenance & Repairs to equipment month -4 Marketing & Promotion: Advertising month 15 Coffee per cup 16 Coffee cups per cup 17 Payroll: Wages (Owner Manager) month 18 Payroll: Wages (per Employees) month 19 Donut and Coffee equipment rent month 20 Professional Fees: Accounting month 21 Professional Fees: Legal month 22 Powdered and Liquid Beverages 23 Rent month Previous research expense for Donuts 24 advancements 25 Supplies Office month 26 Utilities month 27 28 29 30 Additional Data $0.00 $50.00 $0.25 $0.10 $2,500.00 $1,000.00 $500.00 $50.00 $25.00 $0.00 $1,000.00 $1,500.00 $25.00 $200.00 Monthly Production 31 32 High demand, Low Demand, below Lost Sales Day old revenue above average average 4000 3 1.25 22% 26% 33 Franchise 34 Monthly Fed Expense increme 35 Monthly Production Increase 36 Monthly demand increase 7.000.00 321 24% 37 States of Natures 38 Hich demand 39 Average demand 40 Low demand probabilities 20.00% 55.00% 25.00% B D E F G Yearly average Seasonal Index Average SI Deseasonalized Time period Put yearly average in below cell 1 Month Demand 2 1/1/18 3 2/1/18 4 3/1/18 S 4/1/18 6 5/1/18 7 6/1/18 8 7/1/18 9 8/1/18 10 9/1/18 11 10/1/18 12 11/1/18 13 12/1/18 14 1/1/19 15 2/1/19 16 32/19 17 4/1/19 18 S/1/19 19 6/1/19 20 7/1/19 21 8/1/19 22 9/1/15 23 10/1/19 24 11/1/19 25 12/1/19 26 1/1/20 27 2/1/20 28 3./20 29 4/1/20 30 5/1/20 31 6/1/20 32 7/1/20 B/120 9/1/20 15 10/1/20 11/1/20 17 12/120 Put yearly average in below cell Put yearly average in below cell Desa H K M N 0 2 Regression Output CLICK CELL 12 as output cell for regression We the average ander in the comfor year 2018 When you move your forecast to the profit models, you mutation hout copy the wa D Month Demand 1/1/2018 4308 2/1/2018 29863 3/1/2018 32652 4/1/2018 PSTE S/1/2018 S 98SE 6/1/2018 26355 7/1/2018 2556 8/1/2018 2685 9/1/2018 2868 2948 10/1/2018 11/1/2018 34515 12/1/2018 45235 1/1/2019 2402 39735 2/1/20191 1/1/20191 25835 4/1/2019 2556 1400 5 5/1/2019 6/1/2019 36283 7/1/2019 2614 /1/2019 3575 3129 9/1/2019 10/1/2019 3912 41625 11/1/20191 12/1/2019 19583 1/1/2020 21/2020 265 3203 3/20 4056 16.30 4/1/2020 3/1/2020 1981 7/2000 3613 10 uror 13300 ST