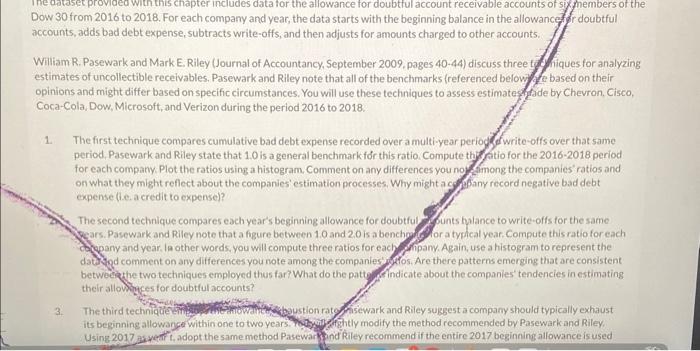
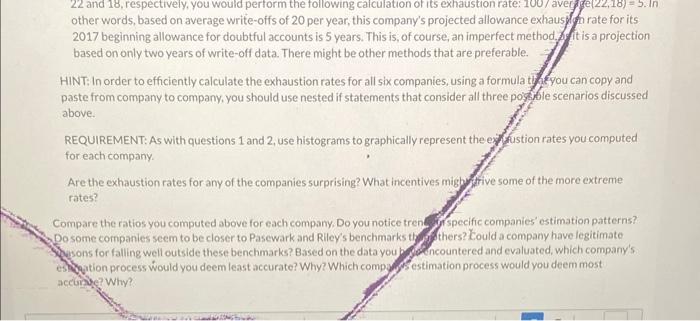
Dow 30 from 2016 to 2018 . For each company and year, the data starts with the beginning balance in the allowanceffr doubtful accounts, adds bad debt expense, subtracts write-offs, and then adjusts for amounts charged to other accounts. William R. Pasewark and Mark E. Riley (Journal of Accountancy, September 2009, pages 40-44) discuss three to f fiques for analyzing estimates of uncollectible receivables. Pasewark and Riley note that all of the benchmarks (referenced belowi 2 based on their opinions and might differ based on specific circumstances. You will use these techniques to assess estimates) fade by Chevron, Cisco, Coca-Cola, Dow, Microsoft, and Verizon during the period 2016 to 2018. 1. The first technique compares cumulative bad debt expense recorded over a multi-year periogfofwrite-offs over that same period. Pasewark and Riley state that 1.0 is a general benchmark for this ratio. Compute thy fitio for the 2016-2018 period for each company. Plot the ratios using a histogram. Comment on any differences you noy fimong the companies' ratios and on what they might reflect about the companies' estimation processes. Why might acgofany record negative bad debt expense (i.e. a credit to expense)? The second technique compares each year's beginning allowance for doubtful funts holance to write-offs for the same Fears. Pasewark and Riley note that a figure between 1.0 and 2.0 is a benchog for a tyrtcal year. Compute this ratio for each caipany and year. Ia other words, you will compute three ratios for each Alipany. Again, use a histogram to represent the dathigd comment on any differences you note among the companies yfos. Are there patterns emerging that are consistent betweek the two techniques employed thus far? What do the patt of findicate about the companies' tendencies in estimating their allowighes for doubtful accounts? its beginning allowange within one to two years. TWb will ghitly modify the method recommended by Pasewark and Riley. Using 2017 as yeat L, adopt the same method Pasewarksind Riley recommend if the entire 2017 beginning allowance is used its beginning allowance within one to two years. You will slightly modify the method recommended by Pasewgrzand Riley. Using 2017 as year t, adopt the same method Pasewark and Riley recommend if the entire 2017 beginning al qwance is used in the form of write-offs by the end of 2017 or 2018. - If the entire 2017 beginning balance is used in the form of write-offs by the end of 2017 , compute th hhaustion rate by dividing the beginning allowance by total 2017 write-offs. - For example, if a company's beginning 2017 allowance balance was 100 and write-offs during 2017 totaled 150 , the exhaustion rate would equal 100/150=0.67, This calculation would indicate that it woulphake two-thirds of a year to use the allowance in the form of write-offs. - If the entire 2017 beginning balance is not used in the form of write offs by the end of 3%, but is used by the end of 2018. compute the unused portion of the allowance at the end of 2017 and divide tha cinused amount by 2018 write-offs. Add one to the result. For example, assume a company had a beginning allowance for doubtful adghts of 100 in 2017 , with write-offs of 75 in 2017 and 50 in 2018. At the end of 2017,25 (100 beginning balance 7 write-pffs) of the company's beginning allowance had not yet been utilized. Therefore, you would take the reding allowance of 25 and divide that amount by the 50 written off in 2018 , to obtain a result of 0.50. Adding thay 1. provides a result of 1.50. In other words, it took one-and-a-half years for the company to utilize its beginnin 2617 allowance in the form of write-offs. - If a cotpany does not utilize its beginning 2017 allowance in y fform of write-offs by the end of 2018 , you will modify Pasewar': 3 and Riley's method, You will assume the write-offiftern for 2017 and 2018 is indicative the pattern for future 2018 to compute 3 brojected allowance exhividing per 22 and 18 , respectively, you would perform the following calculation of its exhaustion rate: 1007 ave 8 rece(22,18) =5. In other words, based on average write-offs of 20 per year, this company's projected allowance exhaus for rate for its 2017 beginning allowance for doubtful accounts is 5 years. This is, of course, an imperfect method. If it is a projection based on only two years of write-off data. There might be other methods that are preferable. HINT: In order to efficiently calculate the exhaustion rates for all six companies, using a formula tif ifyou can copy and paste from company to company, you should use nested if statements that consider all three pojgfle scenarios discussed above. REQUIREMENT: As with questions 1 and 2, use histograms to graphically represent the e for each company. Are the exhaustion rates for any of the companies surprising? What incentives migh ffive some of the more extreme rates? Compare the ratios you computed above for each company. Do you notice tren, fi specific companies' estimation patterns? Do some companies seem to be closer to Pasewark and Riley's benchmarks th G fhers? Kould a company have iegitimate FXypsons for falling well outside these benchmarks? Based on the data you h ferencountered and evaluated, which company's. es Veation processwould you deem least accurate? Why? Which compg y3 estimation process would you deem most accinge? Why? Dow 30 from 2016 to 2018 . For each company and year, the data starts with the beginning balance in the allowanceffr doubtful accounts, adds bad debt expense, subtracts write-offs, and then adjusts for amounts charged to other accounts. William R. Pasewark and Mark E. Riley (Journal of Accountancy, September 2009, pages 40-44) discuss three to f fiques for analyzing estimates of uncollectible receivables. Pasewark and Riley note that all of the benchmarks (referenced belowi 2 based on their opinions and might differ based on specific circumstances. You will use these techniques to assess estimates) fade by Chevron, Cisco, Coca-Cola, Dow, Microsoft, and Verizon during the period 2016 to 2018. 1. The first technique compares cumulative bad debt expense recorded over a multi-year periogfofwrite-offs over that same period. Pasewark and Riley state that 1.0 is a general benchmark for this ratio. Compute thy fitio for the 2016-2018 period for each company. Plot the ratios using a histogram. Comment on any differences you noy fimong the companies' ratios and on what they might reflect about the companies' estimation processes. Why might acgofany record negative bad debt expense (i.e. a credit to expense)? The second technique compares each year's beginning allowance for doubtful funts holance to write-offs for the same Fears. Pasewark and Riley note that a figure between 1.0 and 2.0 is a benchog for a tyrtcal year. Compute this ratio for each caipany and year. Ia other words, you will compute three ratios for each Alipany. Again, use a histogram to represent the dathigd comment on any differences you note among the companies yfos. Are there patterns emerging that are consistent betweek the two techniques employed thus far? What do the patt of findicate about the companies' tendencies in estimating their allowighes for doubtful accounts? its beginning allowange within one to two years. TWb will ghitly modify the method recommended by Pasewark and Riley. Using 2017 as yeat L, adopt the same method Pasewarksind Riley recommend if the entire 2017 beginning allowance is used its beginning allowance within one to two years. You will slightly modify the method recommended by Pasewgrzand Riley. Using 2017 as year t, adopt the same method Pasewark and Riley recommend if the entire 2017 beginning al qwance is used in the form of write-offs by the end of 2017 or 2018. - If the entire 2017 beginning balance is used in the form of write-offs by the end of 2017 , compute th hhaustion rate by dividing the beginning allowance by total 2017 write-offs. - For example, if a company's beginning 2017 allowance balance was 100 and write-offs during 2017 totaled 150 , the exhaustion rate would equal 100/150=0.67, This calculation would indicate that it woulphake two-thirds of a year to use the allowance in the form of write-offs. - If the entire 2017 beginning balance is not used in the form of write offs by the end of 3%, but is used by the end of 2018. compute the unused portion of the allowance at the end of 2017 and divide tha cinused amount by 2018 write-offs. Add one to the result. For example, assume a company had a beginning allowance for doubtful adghts of 100 in 2017 , with write-offs of 75 in 2017 and 50 in 2018. At the end of 2017,25 (100 beginning balance 7 write-pffs) of the company's beginning allowance had not yet been utilized. Therefore, you would take the reding allowance of 25 and divide that amount by the 50 written off in 2018 , to obtain a result of 0.50. Adding thay 1. provides a result of 1.50. In other words, it took one-and-a-half years for the company to utilize its beginnin 2617 allowance in the form of write-offs. - If a cotpany does not utilize its beginning 2017 allowance in y fform of write-offs by the end of 2018 , you will modify Pasewar': 3 and Riley's method, You will assume the write-offiftern for 2017 and 2018 is indicative the pattern for future 2018 to compute 3 brojected allowance exhividing per 22 and 18 , respectively, you would perform the following calculation of its exhaustion rate: 1007 ave 8 rece(22,18) =5. In other words, based on average write-offs of 20 per year, this company's projected allowance exhaus for rate for its 2017 beginning allowance for doubtful accounts is 5 years. This is, of course, an imperfect method. If it is a projection based on only two years of write-off data. There might be other methods that are preferable. HINT: In order to efficiently calculate the exhaustion rates for all six companies, using a formula tif ifyou can copy and paste from company to company, you should use nested if statements that consider all three pojgfle scenarios discussed above. REQUIREMENT: As with questions 1 and 2, use histograms to graphically represent the e for each company. Are the exhaustion rates for any of the companies surprising? What incentives migh ffive some of the more extreme rates? Compare the ratios you computed above for each company. Do you notice tren, fi specific companies' estimation patterns? Do some companies seem to be closer to Pasewark and Riley's benchmarks th G fhers? Kould a company have iegitimate FXypsons for falling well outside these benchmarks? Based on the data you h ferencountered and evaluated, which company's. es Veation processwould you deem least accurate? Why? Which compg y3 estimation process would you deem most accinge? Why


