

Question
Download the data from the following data table a. Compute the average return for each of the assets from 1929 to 1940 (the Great Depression).
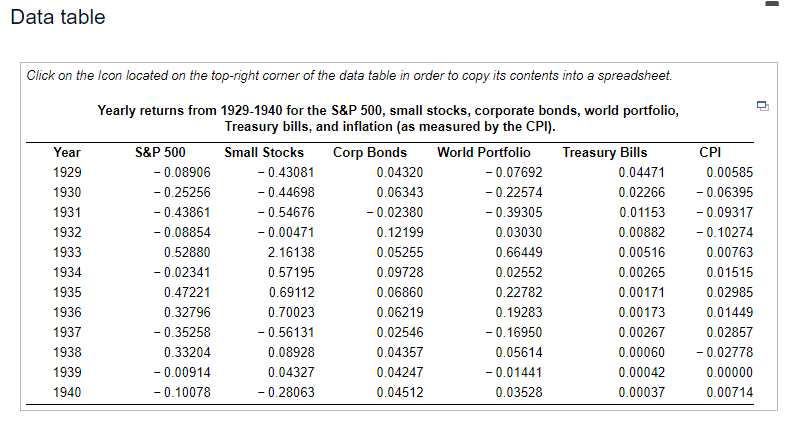
Download the data from the following data table
a. Compute the average return for each of the assets from 1929 to 1940 (the Great Depression).
b. Compute the variance and standard deviation for each of the assets from 1929 to 1940.
c. Which asset was riskiest during the Great Depression? How does that fit with your intuition?
a. Compute the average return for each of the assets from 1929 to 1940 (the Great Depression).
The average return for the S&P 500 was _______ (Round to five decimal places.)
The average return for the Small Stocks was ______ (Round to five decimal places.)
The average return for the Corp Bonds was ______ (Round to five decimal places.)
The average return for the World Portfolio was _______ (Round to five decimal places.)
The average return for the Treasury Bills was _______ (Round to five decimal places.)
The average for the CPI was ______ (Round to five decimal places)
b. Compute the variance and standard deviation for each of the assets from 1929 to 1940.
The variance for the S&P 500 was _______ (Round to five decimal places.)
The variance for the Small Stocks was _______
The variance for the Corp Bonds was ______
The variance for the World Portfolio was ________
The variance for the Treasury Bills was _________
The variance for the CPI was _______
The standard deviation for the S&P 500 was _______
The standard deviation for the Small Stocks was _______
The standard deviation for the Corp Bonds was _______
The standard deviation for the World Portfolio was ________
The standard deviation for the Treasury Bills was _________
The standard deviation for the CPI was _________
c. Which asset was riskiest during the Great Depression? How does that fit with your intuition?
A. The riskiest assets were the Treasury Bills. Intuition tells us that government securities would be the riskiest.
B. The riskiest assets were the small stocks. Intuition tells us that smaller companies should be riskiest.
C. The riskiest assets were the stocks in the S&P 500. Intuition tells us that large companies should be the riskiest.
D. The riskiest assets were the corporate bonds. Intuition tells us that company debt should be riskiest.
- Data table Click on the Icon located on the top-right corner of the data table in order to copy its contents into a spreadsheet. Yearly returns from 1929-1940 for the S&P 500, small stocks, corporate bonds, world portfolio, Treasury bills, and inflation (as measured by the CPI). Year S&P 500 Small Stocks Corp Bonds World Portfolio Treasury Bills 1929 -0.08906 -0.43081 0.04320 -0.07692 0.04471 1930 -0.25256 -0.44698 0.06343 -0.22574 0.02266 1931 -0.43861 -0.54676 -0.02380 -0.39305 0.01153 1932 -0.08854 -0.00471 0.12199 0.03030 0.00882 1933 0.52880 2.16138 0.05255 0.66449 0.00516 1934 -0.02341 0.57195 0.09728 0.02552 0.00265 1935 0.47221 0.69112 0.06860 0.22782 0.00171 1936 0.32796 0.70023 0.06219 0.19283 0.00173 1937 -0.35258 -0.56131 0.02546 -0.16950 0.00267 1938 0.33204 0.08928 0.04357 0.05614 0.00060 1939 -0.00914 0.04327 0.04247 -0.01441 0.00042 1940 -0.10078 -0.28063 0.04512 0.03528 0.00037 CPI 0.00585 -0.06395 -0.09317 -0.10274 0.00763 0.01515 0.02985 0.01449 0.02857 -0.02778 0.00000 0.00714
Step by Step Solution
There are 3 Steps involved in it
Step: 1

Get Instant Access to Expert-Tailored Solutions
See step-by-step solutions with expert insights and AI powered tools for academic success
Step: 2

Step: 3
Ace Your Homework with AI
Get the answers you need in no time with our AI-driven, step-by-step assistance
Get Started
Public Finance
Authors: Harvey Rosen, Ted Gayer
10th Global Edition
007715469X, 978-0077154691