Question
Download the file airDensity.dat. The file contains values of the air density (in lb/ft3 ) at a range of temperatures (in F, the top data
Download the file airDensity.dat. The file contains values of the air density (in lb/ft3 ) at a range of temperatures (in F, the top data row) and pressures (in PSI, the first column). Address following requests by creating one MATLAB script file and executing it in the Command Window.

Air density dat data
temperature (C) speed of sound (m/s) density (kg/m3) impedance (Ns/m3) 35 351.88 1.1455 403.2 30 349.02 1.1644 406.5 25 346.13 1.1839 409.4 20 343.21 1.2041 413.3 15 340.27 1.225 416.9 10 337.31 1.2466 420.5 5 334.32 1.269 424.3 0 331.3 1.2922 428 - 5 328.25 1.3163 432.1 - 10 325.18 1.3413 436.1 - 15 322.07 1.3673 440.3 - 20 318.94 1.3943 444.6 - 25 315.77 1.4224 449.1
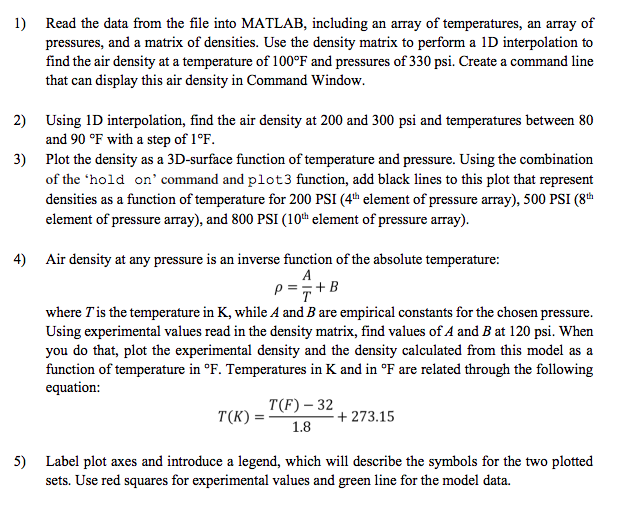
1) Read the data from the file into MATLAB, including an array of temperatures, an array of pressures, and a matrix of densities. Use the density matrix to perform a 1D interpolation to find the air density at a temperature of 100F and pressures of 330 psi. Create a command line that can display this air density in Command Window 2) Using 1D interpolation, find the air density at 200 and 300 psi and temperatures between 80 and 90 F with a step of 1F Plot the density as a 3D-surface function of temperature and pressure. Using the combination of the 'hold on' command and plot3 function, add black lines to this plot that represent densities as a function of temperature for 200 PSI (4th element of pressure array), 500 PSI (8th element of pressure array), and 800 PSI (10h element of pressure array). 3) 4) Air density at any pressure is an inverse function of the absolute temperature: where Tis the temperature in K, while A and B are empirical constants for the chosen pressure Using experimental values read in the density matrix, find values of A and B at 120 psi. When you do that, plot the experimental density and the density calculated from this model as a function of temperature in F. Temperatures in K and in F are related through the following equation: T(F)- 32 T(K)+ 273.15 1.8 5) Label plot axes and introduce a legend, which will describe the symbols for the two plotted sets. Use red squares for experimental values and green line for the model data. 1) Read the data from the file into MATLAB, including an array of temperatures, an array of pressures, and a matrix of densities. Use the density matrix to perform a 1D interpolation to find the air density at a temperature of 100F and pressures of 330 psi. Create a command line that can display this air density in Command Window 2) Using 1D interpolation, find the air density at 200 and 300 psi and temperatures between 80 and 90 F with a step of 1F Plot the density as a 3D-surface function of temperature and pressure. Using the combination of the 'hold on' command and plot3 function, add black lines to this plot that represent densities as a function of temperature for 200 PSI (4th element of pressure array), 500 PSI (8th element of pressure array), and 800 PSI (10h element of pressure array). 3) 4) Air density at any pressure is an inverse function of the absolute temperature: where Tis the temperature in K, while A and B are empirical constants for the chosen pressure Using experimental values read in the density matrix, find values of A and B at 120 psi. When you do that, plot the experimental density and the density calculated from this model as a function of temperature in F. Temperatures in K and in F are related through the following equation: T(F)- 32 T(K)+ 273.15 1.8 5) Label plot axes and introduce a legend, which will describe the symbols for the two plotted sets. Use red squares for experimental values and green line for the model dataStep by Step Solution
There are 3 Steps involved in it
Step: 1

Get Instant Access to Expert-Tailored Solutions
See step-by-step solutions with expert insights and AI powered tools for academic success
Step: 2

Step: 3

Ace Your Homework with AI
Get the answers you need in no time with our AI-driven, step-by-step assistance
Get Started


