Answered step by step
Verified Expert Solution
Question
1 Approved Answer
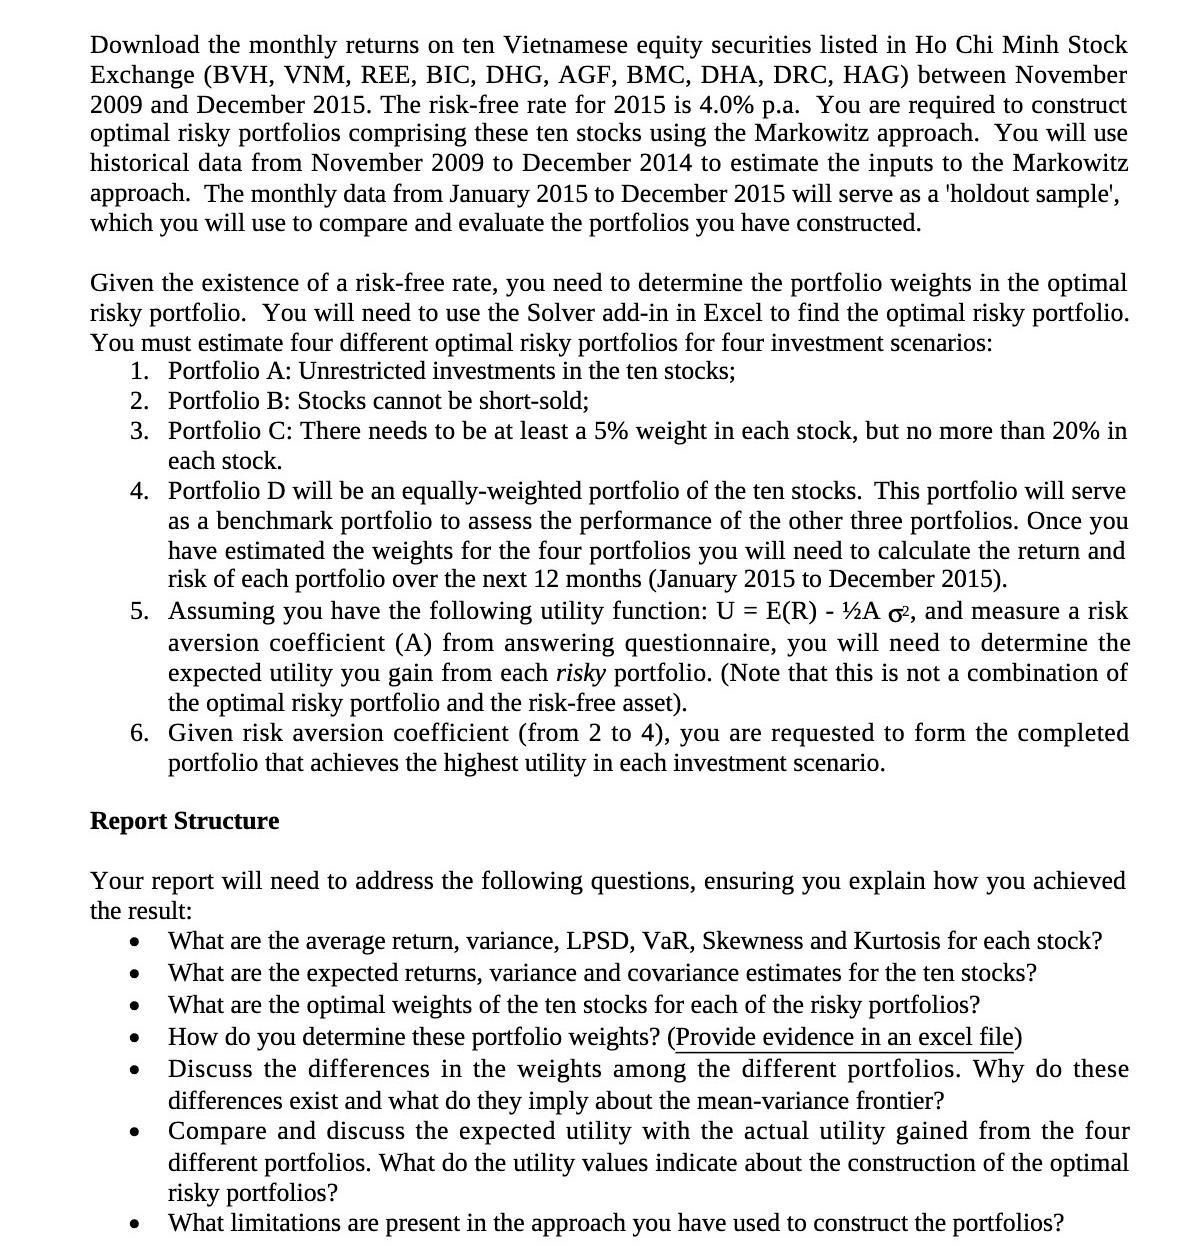
Download the monthly returns on ten Vietnamese equity securities listed in Ho Chi Minh Stock Exchange (BVH, VNM, REE, BIC, DHG, AGF, BMC, DHA,

Download the monthly returns on ten Vietnamese equity securities listed in Ho Chi Minh Stock Exchange (BVH, VNM, REE, BIC, DHG, AGF, BMC, DHA, DRC, HAG) between November 2009 and December 2015. The risk-free rate for 2015 is 4.0% p.a. You are required to construct optimal risky portfolios comprising these ten stocks using the Markowitz approach. You will use historical data from November 2009 to December 2014 to estimate the inputs to the Markowitz approach. The monthly data from January 2015 to December 2015 will serve as a 'holdout sample', which you will use to compare and evaluate the portfolios you have constructed. Given the existence of a risk-free rate, you need to determine the portfolio weights in the optimal risky portfolio. You will need to use the Solver add-in in Excel to find the optimal risky portfolio. You must estimate four different optimal risky portfolios for four investment scenarios: 1. Portfolio A: Unrestricted investments in the ten stocks; 2. Portfolio B: Stocks cannot be short-sold; 3. Portfolio C: There needs to be at least a 5% weight in each stock, but no more than 20% in each stock. 4. Portfolio D will be an equally-weighted portfolio of the ten stocks. This portfolio will serve as a benchmark portfolio to assess the performance of the other three portfolios. Once you have estimated the weights for the four portfolios you will need to calculate the return and risk of each portfolio over the next 12 months (January 2015 to December 2015). 5. Assuming you have the following utility function: U = E(R) - 12A 6, and measure a risk aversion coefficient (A) from answering questionnaire, you will need to determine the expected utility you gain from each risky portfolio. (Note that this is not a combination of the optimal risky portfolio and the risk-free asset). 6. Given risk aversion coefficient (from 2 to 4), you are requested to form the completed portfolio that achieves the highest utility in each investment scenario. Report Structure Your report will need to address the following questions, ensuring you explain how you achieved the result: What are the average return, variance, LPSD, VaR, Skewness and Kurtosis for each stock? What are the expected returns, variance and covariance estimates for the ten stocks? What are the optimal weights of the ten stocks for each of the risky portfolios? How do you determine these portfolio weights? (Provide evidence in an excel file) Discuss the differences in the weights among the different portfolios. Why do these differences exist and what do they imply about the mean-variance frontier? Compare and discuss the expected utility with the actual utility gained from the four different portfolios. What do the utility values indicate about the construction of the optimal risky portfolios? What limitations are present in the approach you have used to construct the portfolios?
Step by Step Solution
★★★★★
3.48 Rating (158 Votes )
There are 3 Steps involved in it
Step: 1
To accomplish this task youll need to follow these steps Data Collection and Analysis Download month...
Get Instant Access to Expert-Tailored Solutions
See step-by-step solutions with expert insights and AI powered tools for academic success
Step: 2

Step: 3

Ace Your Homework with AI
Get the answers you need in no time with our AI-driven, step-by-step assistance
Get Started


