

Question
Download the Twitter dataset below. It contains an export of actual tweets about the Amazon Web Services (AWS) cloud computing platform. Begin by examining the
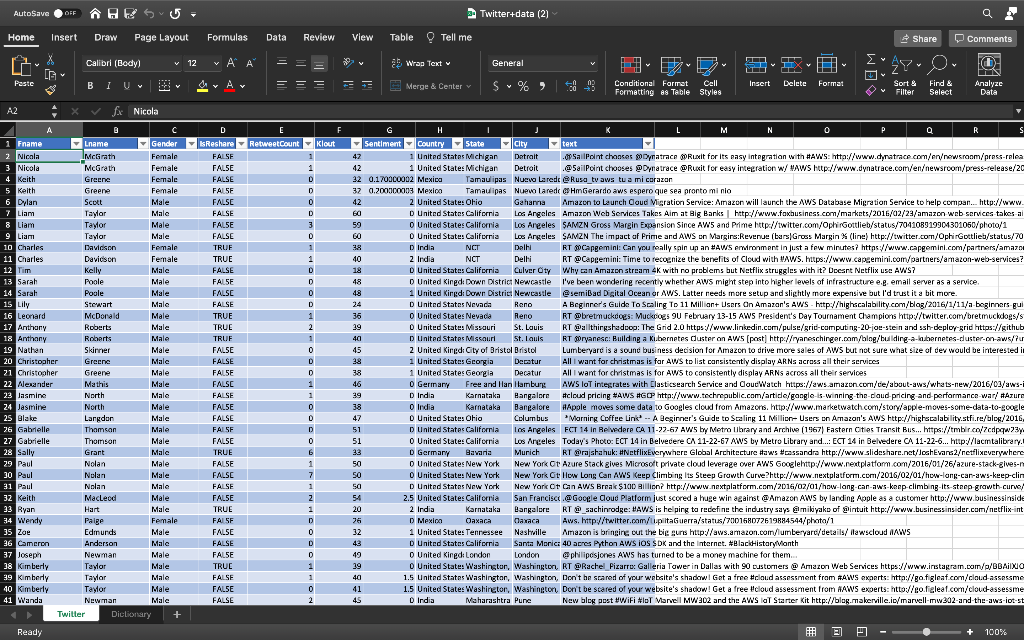
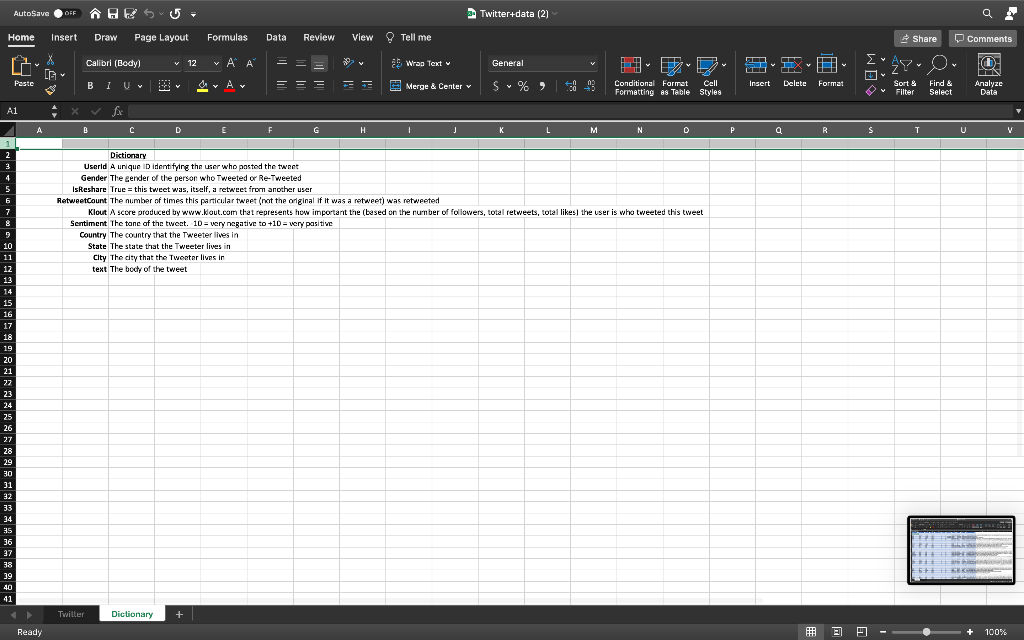
Download the Twitter dataset below. It contains an export of actual tweets about the Amazon Web Services (AWS) cloud computing platform. Begin by examining the data as well as the data dictionary to undertstand what variables you have access to.
Assume that you work for Amazon Web Services. Your job is to learn what story(ies) this data set has to tell. Identify at least three metrics with visualizations that may explain why some tweets are retweeted more than others. Integrate these charts into a dashboard. Then, create a story that explains these metrics.
You will have two deliverables for this checkpoint.
- First, upload your Tableau workbook (.twbx file) below while being sure to save the dashboard and story in your workbook with the 3+ insights briefly described in the Tableau story as demonstrated in the Getting Started video. Clearly, there is room for creativity and interpretation here. There is a very wide range of acceptable insights. But keep in mind: your goal is to explain why some tweets are retweeted more than others
- Second, give a theoretical interpretation for each of the three metrics to explain why those metrics/dimensions affect the number of retweets.
- For example, "Tweeters from California are likely to get retweeted more often because they live in Silicon Valley--one of, if not the, tech capital of the world. Therefore, people believe that they are more likely to know what they are talking about."
-
Explain the #1 reason you believe Tweeters get retweeted: (this is basically Story Point 1 in the Tableau Story you created)
-
Explain the #2 reason you believe Tweeters get retweeted: (this is basically Story Point 2 in the Tableau Story you created)
-
Explain the #3 reason you believe Tweeters get retweeted: (this is basically Story Point 3 in the Tableau Story you created)
Step by Step Solution
There are 3 Steps involved in it
Step: 1

Get Instant Access to Expert-Tailored Solutions
See step-by-step solutions with expert insights and AI powered tools for academic success
Step: 2

Step: 3
Ace Your Homework with AI
Get the answers you need in no time with our AI-driven, step-by-step assistance
Get Started
Personal Finance
Authors: E. Thomas Garman, Raymond E. Forgue, Jonathan Fox
14th Edition
0357901495, 9780357901496