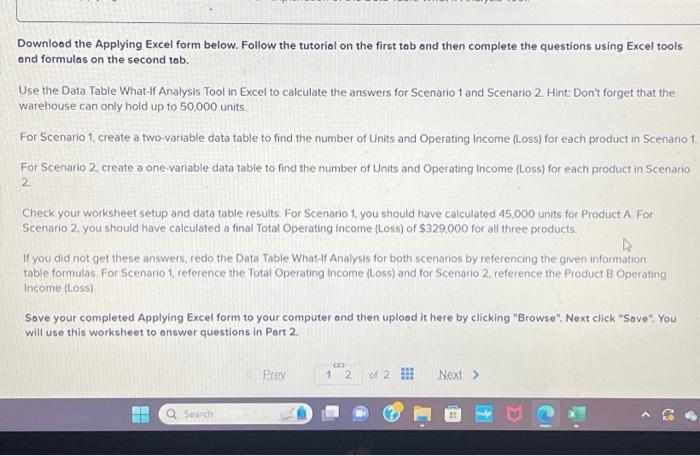
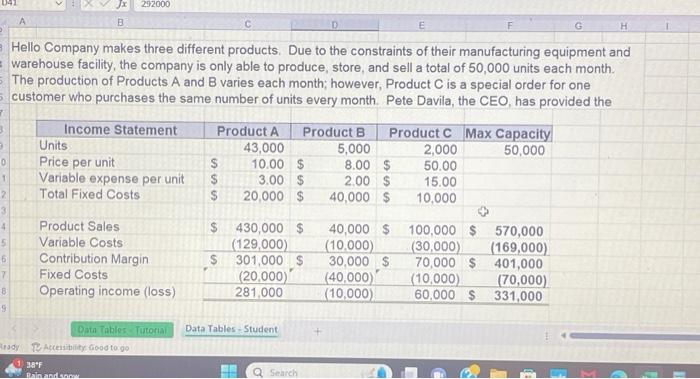
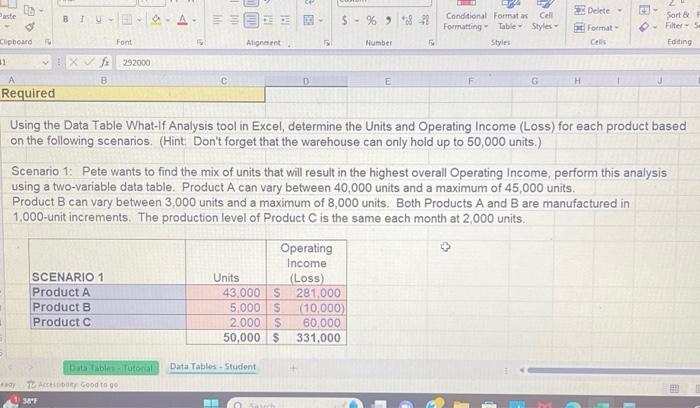
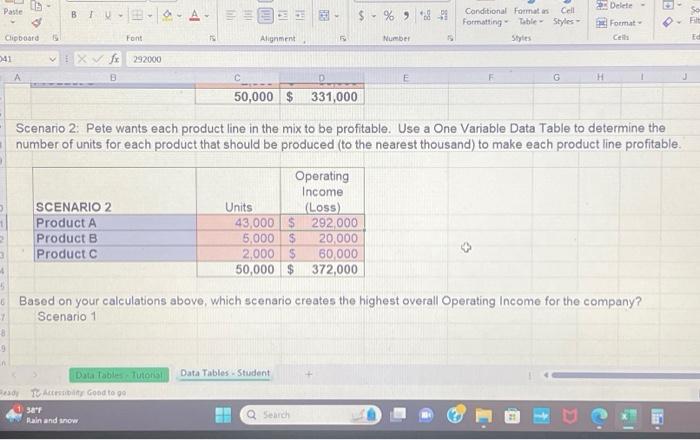
Downlood the Applying Excel form below. Follow the tutorial on the first tab and then complete the questions using Excel tools and formulas on the second tab. Use the Data Table What-If Analysis Tool in Excel to calculate the answers for Scenario 1 and Scenario 2 Hint: Don't forget that the warehouse can only hold up to 50,000 units. For Scenario 1, create a two-variable data table to find the number of Units and Operating Income (Loss) for each product in Scenario For Scenatio 2, create a one variable data table to find the number of Units and Operating income (Loss) for each product in Scenario 2. Check your worksheet setup and data table results. For Scenario 1, you should have calculated 45,000 units for Product A for Scenario 2, you should have calculated a final Total Operating income (Loss) of $329,000 for all three products. If you did not get these answers, redo the Data Table What-ff Analysis for both scenarios by referencing the given information table formulas. For Scenario 1, reference the Total Operating income (Loss) and for Scenario 2, reference the Product B Operating income (toss) Sove your completed Applying Excel form to your computer and then uplood it here by clicking "Browse". Next click "Sove". You will use this worksheet to onswer questions in Port 2. Hello Company makes three different products. Due to the constraints of their manufacturing equipment and warehouse facility, the company is only able to produce, store, and sell a total of 50,000 units each month. The production of Products A and B varies each month; however, Product C is a special order for one customer who purchases the same number of units every month. Pete Davila, the CEO, has provided the Using the Data Table What-If Analysis tool in Excel, determine the Units and Operating Income (Loss) for each product based on the following scenarios. (Hint. Don't forget that the warehouse can only hold up to 50,000 units.) Scenario 1: Pete wants to find the mix of units that will result in the highest overall Operating Income, perform this analysis using a two-variable data table. Product A can vary between 40,000 units and a maximum of 45,000 units. Product B can vary between 3,000 units and a maximum of 8,000 units. Both Products A and B are manufactured in 1,000-unit increments. The production level of Product C is the same each month at 2,000 units. Scenario 2: Pete wants each product line in the mix to be profitable. Use a One Variable Data Table to determine the number of units for each product that should be produced (to the nearest thousand) to make each product line profitable. Based on your calculations above, which scenario creates the highest overall Operating Income for the company? Scenario 1


