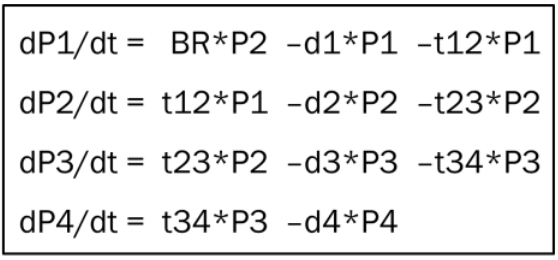
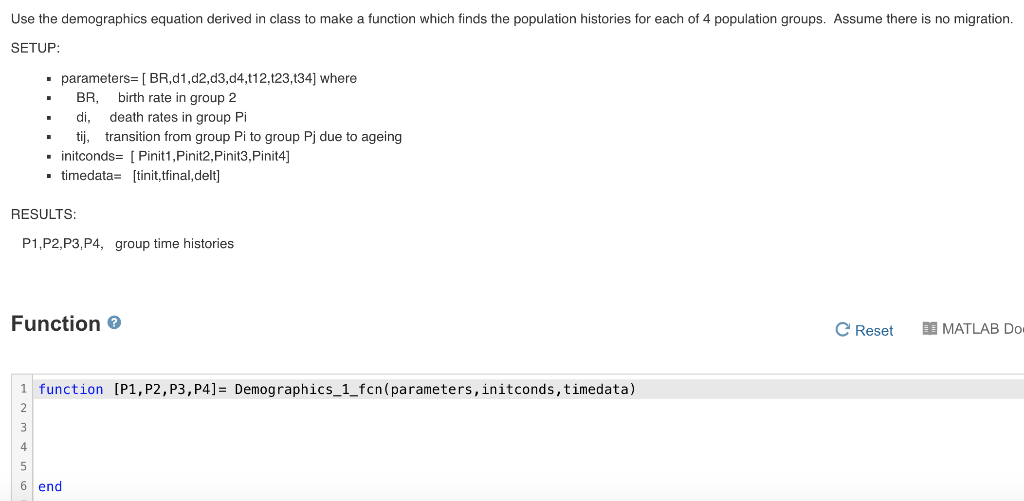
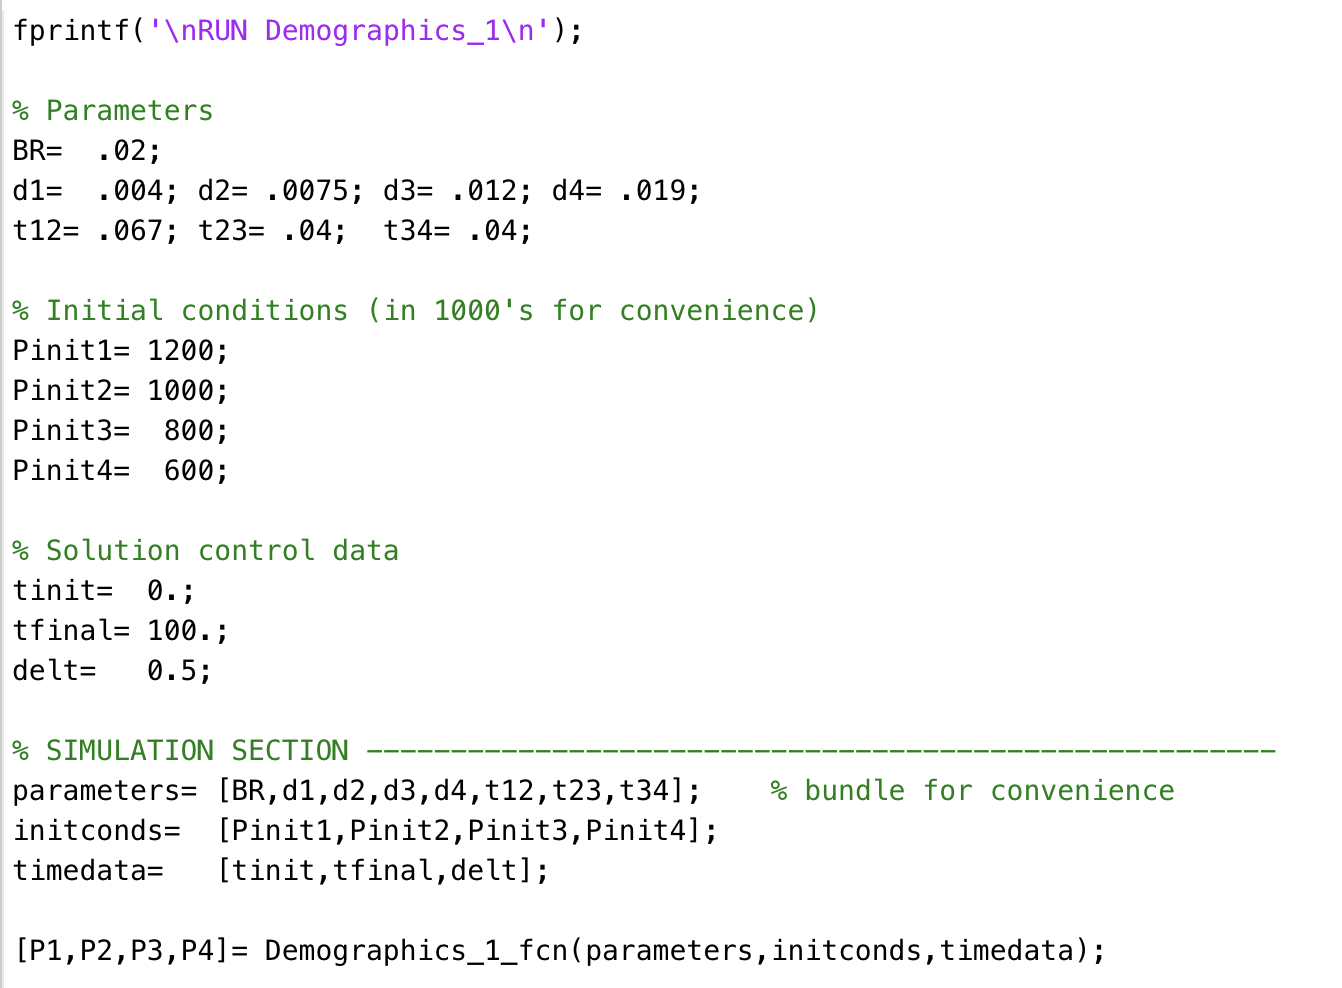
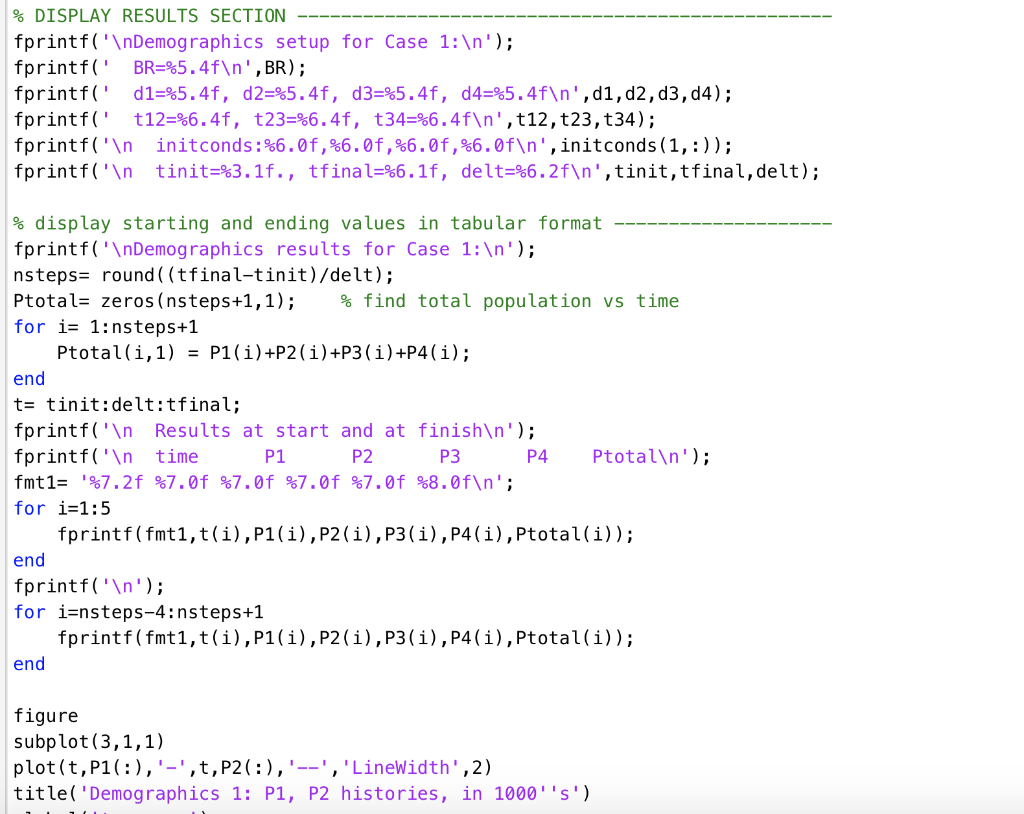
dP1/dt = BR*P2 -d1*P1 -t12*P1 dP2/dt = t12*P1 -d2*P2 -t23*P2 dP3/dt = t23*P2 -d3*P3 -t34*P3 dP4/dt = t34*P3 -d4*P4 Use the demographics equation derived in class to make function which finds the population histories for each of 4 population groups. Assume there is no migration. SETUP: . parameters= [BR.d1.d2d3d4,112,123,134] where BR birth rate in group 2 di, death rates in group Pi tij, transition from group Pi to group Pj due to ageing initconds= [ Pinit1, Pinit2, Pinit3, Pinit4] . timedata= [tinit,tfinal, delt] RESULTS: P1, P2,P3, P4, group time histories Function C Reset MATLAB Do 1 function (P1, P2, P3, P4]= Demographics_1_fcn(parameters, initconds, timedata) 5 6 end fprintf('\NRUN Demographics_1 '); % Parameters BR= .02; d1= .004; d2= .0075; d3= .012; d4= .019; t12= .067; t23= .04; t34= .04; % Initial conditions (in 1000's for convenience) Pinit1= 1200; Pinit2= 1000; Pinit3= 800; Pinit4= 600; % Solution control data tinit= 0.; tfinal= 100.; delt= 0.5; % bundle for convenience % SIMULATION SECTION parameters= [BR, d1, d2,d3, 04, t12,t23, t34]; initconds= [Piniti, Pinit2, Pinit3, Pinit4]; timedata= [tinit,tfinal, delt]; [P1, P2, P3, P4]= Demographics_1_fcn (parameters, initconds, timedata); % DISPLAY RESULTS SECTION fprintf(' Demographics setup for Case 1: '); fprintf(' BR=%5.4f ',BR); fprintf('d1=%5.4f, d2=%5.4f, d3=%5.4f, d4=%5.4f ',di, d2, d3,04); fprintf(' t12=%6.4f, t23=%6.4f, t34=%6.4f ', t12, t23, t34); fprintf(' initconds:%6.0f,%6.0f,%6.0f,%6.0f ', initconds(1,:)); fprintf(" tinit=%3.1f., tfinal=%6.1f, delt=%6.2f ', tinit,tfinal, delt); % display starting and ending values in tabular format fprintf(' Demographics results for Case 1: '); nsteps= round((tfinal-tinit)/delt); Ptotal= zeros(nsteps+1,1); % find total population vs time for i= 1:nsteps+1 Ptotal(i,1) = P1(i) +P2(i)+P3(i) +P4(i); end t= tinit:delt:tfinal; fprintf(" Results at start and at finish '); fprintf(' time P1 P2 P3 P4 Ptotal '); fmt1= '%7.2f %7.0f %7.0f %7.0f %7.0f %8.0f '; for i=1:5 fprintf(fmt1,t(i),P1(i),P2(i),P3(i),P4(i), Ptotal(i)); end fprintf(' '); for i=nsteps-4:nsteps+1 fprintf(fmti,t(i),P1(i),P2(i),P3(i),P4(i), Ptotal(i)); end figure subplot(3,1,1) plot(t,P1(:),'-',t,P2(:),'--', 'LineWidth',2) title('Demographics 1: P1, P2 histories, in 1000''s') dP1/dt = BR*P2 -d1*P1 -t12*P1 dP2/dt = t12*P1 -d2*P2 -t23*P2 dP3/dt = t23*P2 -d3*P3 -t34*P3 dP4/dt = t34*P3 -d4*P4 Use the demographics equation derived in class to make function which finds the population histories for each of 4 population groups. Assume there is no migration. SETUP: . parameters= [BR.d1.d2d3d4,112,123,134] where BR birth rate in group 2 di, death rates in group Pi tij, transition from group Pi to group Pj due to ageing initconds= [ Pinit1, Pinit2, Pinit3, Pinit4] . timedata= [tinit,tfinal, delt] RESULTS: P1, P2,P3, P4, group time histories Function C Reset MATLAB Do 1 function (P1, P2, P3, P4]= Demographics_1_fcn(parameters, initconds, timedata) 5 6 end fprintf('\NRUN Demographics_1 '); % Parameters BR= .02; d1= .004; d2= .0075; d3= .012; d4= .019; t12= .067; t23= .04; t34= .04; % Initial conditions (in 1000's for convenience) Pinit1= 1200; Pinit2= 1000; Pinit3= 800; Pinit4= 600; % Solution control data tinit= 0.; tfinal= 100.; delt= 0.5; % bundle for convenience % SIMULATION SECTION parameters= [BR, d1, d2,d3, 04, t12,t23, t34]; initconds= [Piniti, Pinit2, Pinit3, Pinit4]; timedata= [tinit,tfinal, delt]; [P1, P2, P3, P4]= Demographics_1_fcn (parameters, initconds, timedata); % DISPLAY RESULTS SECTION fprintf(' Demographics setup for Case 1: '); fprintf(' BR=%5.4f ',BR); fprintf('d1=%5.4f, d2=%5.4f, d3=%5.4f, d4=%5.4f ',di, d2, d3,04); fprintf(' t12=%6.4f, t23=%6.4f, t34=%6.4f ', t12, t23, t34); fprintf(' initconds:%6.0f,%6.0f,%6.0f,%6.0f ', initconds(1,:)); fprintf(" tinit=%3.1f., tfinal=%6.1f, delt=%6.2f ', tinit,tfinal, delt); % display starting and ending values in tabular format fprintf(' Demographics results for Case 1: '); nsteps= round((tfinal-tinit)/delt); Ptotal= zeros(nsteps+1,1); % find total population vs time for i= 1:nsteps+1 Ptotal(i,1) = P1(i) +P2(i)+P3(i) +P4(i); end t= tinit:delt:tfinal; fprintf(" Results at start and at finish '); fprintf(' time P1 P2 P3 P4 Ptotal '); fmt1= '%7.2f %7.0f %7.0f %7.0f %7.0f %8.0f '; for i=1:5 fprintf(fmt1,t(i),P1(i),P2(i),P3(i),P4(i), Ptotal(i)); end fprintf(' '); for i=nsteps-4:nsteps+1 fprintf(fmti,t(i),P1(i),P2(i),P3(i),P4(i), Ptotal(i)); end figure subplot(3,1,1) plot(t,P1(:),'-',t,P2(:),'--', 'LineWidth',2) title('Demographics 1: P1, P2 histories, in 1000''s')