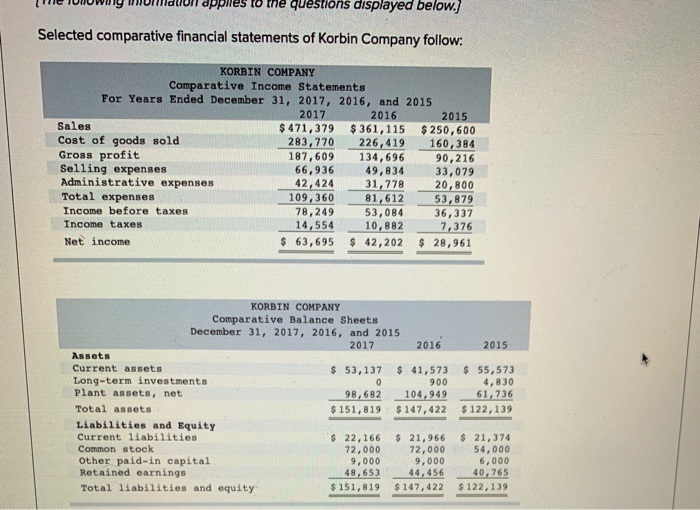
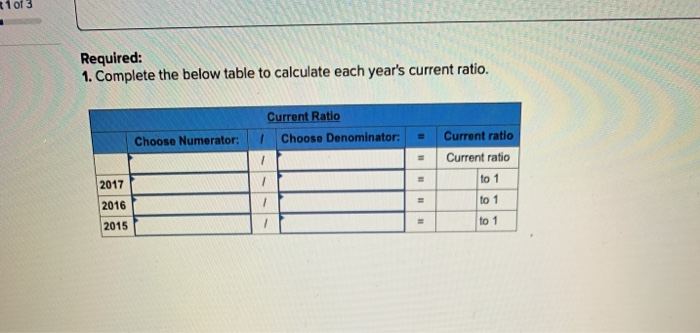
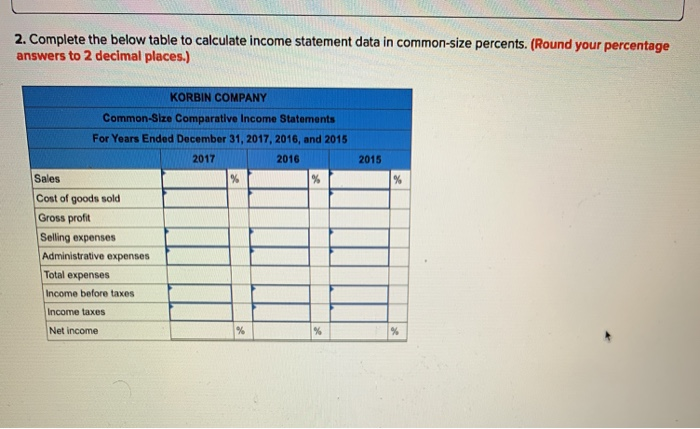
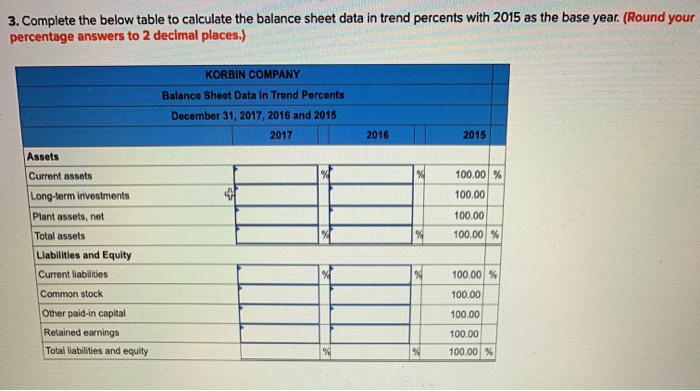
dppies to the questions displayed below.) Selected comparative financial statements of Korbin Company follow: KORBIN COMPANY Comparative Income Statements For Years Ended December 31, 2017, 2016, and 2015 2017 2016 2015 Sales $ 471,379 $361,115 $ 250,600 Cost of goods sold 283, 770 226,419 160,384 Gross profit 187,609 134,696 90,216 Selling expenses 66,936 49,834 33,079 Administrative expenses 42, 424 31,778 20,800 Total expenses 109,360 81,612 53,879 Income before taxes 78,249 53,084 36,337 Income taxes 14,554 10,882 7,376 Net income $ 63,695 $ 42,202 $ 28,961 2015 KORBIN COMPANY Comparative Balance Sheets December 31, 2017, 2016, and 2015 2017 2016 Assets Current assets $ 53,137 $ 41,573 Long-term investments 0 900 Plant assets, net 98,682 104, 949 Total assets $ 151,819 $ 147, 422 Liabilities and Equity Current liabilities $ 22,166 $ 21,966 Common stock 72,000 72,000 Other paid-in capital 9,000 9,000 Retained earnings 48,653 44, 456 Total liabilities and equity $ 151,819 $ 147,422 $ 55,573 4,830 61,736 $ 122,139 $ 21,374 54,000 6,000 40,765 $ 122,139 1 of 3 Required: 1. Complete the below table to calculate each year's current ratio. Current Ratio 1 Choose Denominator: Choose Numerator: 11 Current ratio Current ratio to 1 to 1 2017 1 2016 1 2015 to 1 2. Complete the below table to calculate income statement data in common-size percents. (Round your percentage answers to 2 decimal places.) 2015 % KORBIN COMPANY Common-Size Comparative Income Statements For Years Ended December 31, 2017, 2016, and 2015 2017 2016 Sales % % Cost of goods sold Gross profit Selling expenses Administrative expenses Total expenses Income before taxes Income taxes Net income % % 3. Complete the below table to calculate the balance sheet data in trend percents with 2015 as the base year. (Round your percentage answers to 2 decimal places.) KORBIN COMPANY Balance Sheet Data In Trend Percents December 31, 2017, 2016 and 2015 2017 2016 2015 100.00 % 100.00 100.00 100,00 % % Assets Current assets Long-term investments Plant assets, net Total assets Llabilities and Equity Current liabilities Common stock Other paid-in capital Retained earnings Total liabilities and equity 100.00 % 100.00 100,00 100.00 100.00 %