

Question
Draper Consulting Inc. Balance Sheet December 31, 2013 and 2012 2013 2012 Assets: Current Assets: Cash 514,936 16,350 Accounts Receivable 37,500 1,750 Supplies 2,200 200
| Draper Consulting Inc. | ||
| Balance Sheet | ||
| December 31, 2013 and 2012 | ||
| 2013 | 2012 | |
| Assets: | ||
| Current Assets: | ||
| Cash | 514,936 | 16,350 |
| Accounts Receivable | 37,500 | 1,750 |
| Supplies | 2,200 | 200 |
| Total Current Assets | 554,636 | 18,300 |
| Plant Assets: | ||
| Equipment | 16,000 | 1,800 |
| Less: Accumulated Depreciation - Equipment | (440) | (30) |
| Furniture | 5,700 | 4,200 |
| Less: Accumulated Depreciation - Furniture | (661) | (70) |
| Building | 125,000 | 0 |
| Less: Accumulated Depreciation - Building | (1,652) | 0 |
| Total Assets | 698,583 | 24,200 |
| Liabilities: | ||
| Current Liabilities: | ||
| Accounts Payable | 10,000 | 4,650 |
| Salary Payable | 4,100 | 685 |
| Unearned Service Revenue | 0 | 700 |
| Total Current Liabilities | 14,100 | 6,035 |
| Long-Term Liabilities: | ||
| Interest Payable | 10,667 | 0 |
| Notes Payable | 40,000 | 0 |
| Bonds Payable | 400,000 | 0 |
| Less: Discount on Bonds Payable | (36,184) | 0 |
| Total Liabilities | 428,583 | 6,035 |
| Stockholders' Equity: | ||
| Common Stock | 130,000 | 18,000 |
| Retained Earnings | 140,000 | 165 |
| Total Stockholders' Equity | 270,000 | 18,165 |
| Total Liabilities and Stockholders' Equity | 698,583 | 24,200 |
| Draper Consulting Inc. | ||
| Income Statement | ||
| Year Ended December 31, 2012 | ||
| Revenue: | ||
| Service Revenue | 3,850 | |
| Expenses: | ||
| Rent Expense | 550 | |
| Utilities Expense | 250 | |
| Salary Expense | 685 | |
| Depreciation Expense - Equipment | 30 | |
| Depreciation Expense - Furniture | 70 | |
| Supplies Expense | 700 | |
| Total Expenses | 2,285 | |
| Net Income | 1,565 | |
Requirement 2
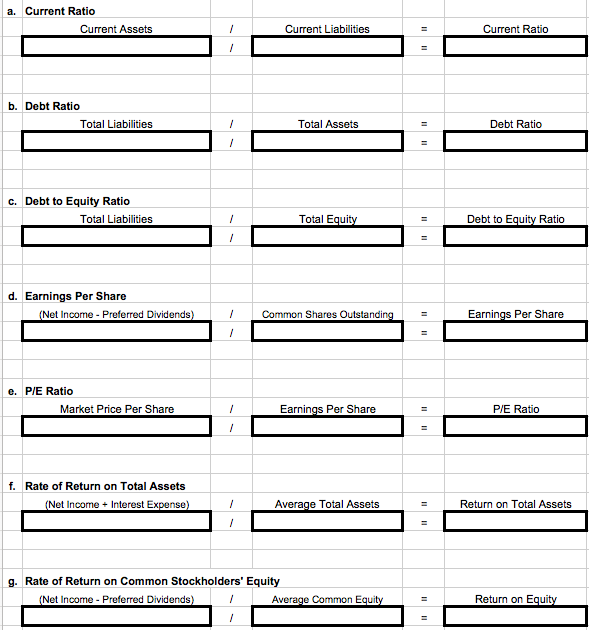
Based on the financial statements provided and assuming the market price of Drapers stock is $200 per share and there are 100 shares of common stock outstanding, calculate the following ratios for the year ended December 31, 2012. Round all amounts to TWO places past the decimal point. Show your calculations in the boxes provided.
Current Ratio
Debt Ratio
Debt to Equity Ratio
Earnings per Share
Price to Earnings Ratio
Rate of Return on Total Assets*
Rate of Return on Common Stockholders Equity*
*Note: Use the current year amounts instead of averages for calculations.
Step by Step Solution
There are 3 Steps involved in it
Step: 1

Get Instant Access to Expert-Tailored Solutions
See step-by-step solutions with expert insights and AI powered tools for academic success
Step: 2

Step: 3
Ace Your Homework with AI
Get the answers you need in no time with our AI-driven, step-by-step assistance
Get Started
Payroll Accounting 2021
Authors: Bernard J. Bieg, Judith A. Toland
31st Edition
0357358287, 9780357358283