

Answered step by step
Verified Expert Solution
Question
1 Approved Answer
Draw a data flow diagram (DFD) to model the handling of weekly quizzes in a traditional classroom course : Quizzes are prepared by the professor
Draw a data flow diagram (DFD) to model the handling of weekly quizzes in a traditional classroom course : 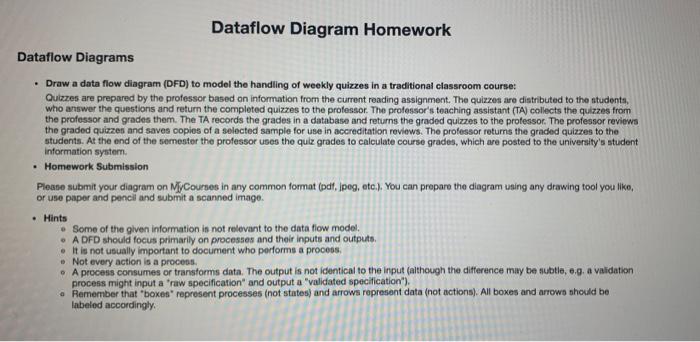
Dataflow Diagram Homework Dataflow Diagrams Draw a data flow diagram (DFD) to model the handling of weekly quizzes in a traditional classroom course: Quizzes are prepared by the professor based on information from the current reading assignment. The quizzes are distributed to the students, who answer the questions and return the completed quizzes to the professor. The professor's teaching assistant (TA) collects the quizzes from the professor and grades them. The TA records the grades in a database and returns the graded quizzes to the professor. The professor reviews the graded quizzes and saves copies of a selected sample for use in accreditation reviews. The professor returns the graded quizzes to the students. At the end of the semester the professor uses the quiz grades to calculate course grades, which are posted to the university's student Information system Homework Submission Please submit your diagram on MyCourses in any common format (pdf, jpog, etc.). You can prepare the diagram using any drawing tool you liko, or use paper and pencil and submit a scanned image. Hints Some of the given information is not relevant to the data flow model A DFD should focus primarily on processes and their inputs and outputs. . It is not usually important to document who performs a process Not every action is a process . A process consumes or transforms data. The output is not identical to the input (although the difference may be subtle, eg, a validation process might input a "raw specification and output a "validated specification"). . Remember that boxen" represent processes (not states) and arrows represent data (not actions). All boxes and arrows should be labeled accordingly Quizzes are prepared by the professor based on information from the current reading assignment. The quizzes are distributed to the students, who answer the questions and return the completed quizzes to the professor. The professor's teaching assistant (TA) collects the quizzes from the professor and grades them. The TA records the grades in a database and returns the graded quizzes to the professor. The professor reviews the graded quizzes and save copies of a selected sample for use in accreditation reviews. The professor returns the graded quizzes to the students. At the end of the semester the professor uses the quiz grades to calculate course grades, which are posted to the university's student information system.
Step by Step Solution
There are 3 Steps involved in it
Step: 1

Get Instant Access to Expert-Tailored Solutions
See step-by-step solutions with expert insights and AI powered tools for academic success
Step: 2

Step: 3
Ace Your Homework with AI
Get the answers you need in no time with our AI-driven, step-by-step assistance
Get Started
Database Design Application Development And Administration
Authors: Michael V. Mannino
4th Edition
0615231047, 978-0615231044