Answered step by step
Verified Expert Solution
Question
1 Approved Answer
Draw a Demand Curve on the graph below that illustrates Long-Run Profit-Maximizing Equilibrium in a Perfectly Competitive Market. Assume that the Market Price =$30 and
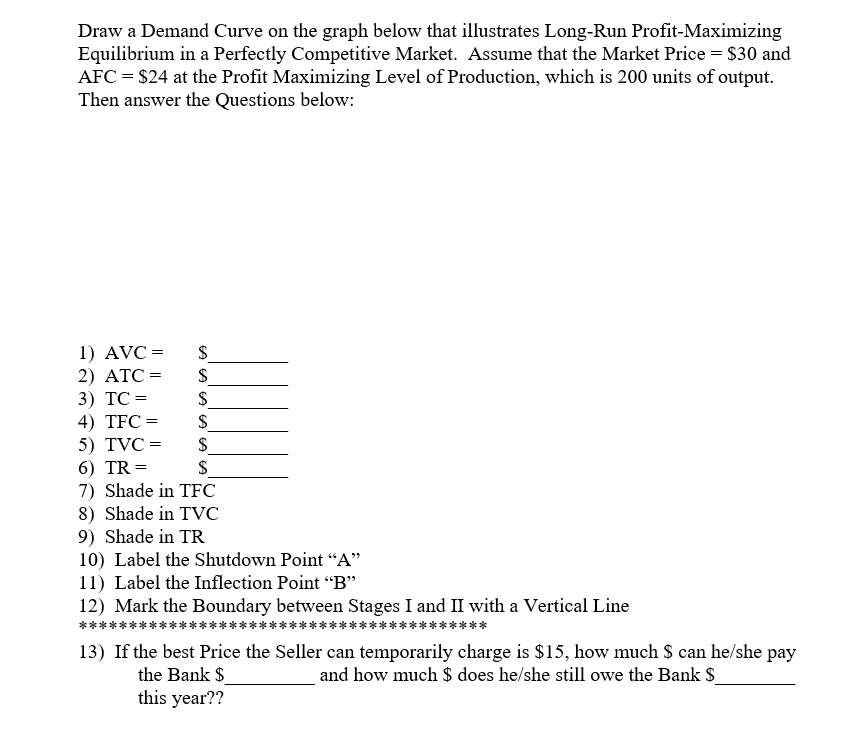
Draw a Demand Curve on the graph below that illustrates Long-Run Profit-Maximizing Equilibrium in a Perfectly Competitive Market. Assume that the Market Price =$30 and AFC=$24 at the Profit Maximizing Level of Production, which is 200 units of output. Then answer the Questions below: 1) AVC=$ 2) ATC=$ 3) TC=$ 4) TFC=$ 5) TVC=$ 6) TR=$ 7) Shade in TFC 8) Shade in TVC 9) Shade in TR 10) Label the Shutdown Point "A" 11) Label the Inflection Point "B" 12) Mark the Boundary between Stages I and II with a Vertical Line 13) If the best Price the Seller can temporarily charge is $15, how much $ can he/she pay the Bank $ and how much $ does he/she still owe the Bank \$ this year?? Draw a Demand Curve on the graph below that illustrates Long-Run Profit-Maximizing Equilibrium in a Perfectly Competitive Market. Assume that the Market Price =$30 and AFC=$24 at the Profit Maximizing Level of Production, which is 200 units of output. Then answer the Questions below: 1) AVC=$ 2) ATC=$ 3) TC=$ 4) TFC=$ 5) TVC=$ 6) TR=$ 7) Shade in TFC 8) Shade in TVC 9) Shade in TR 10) Label the Shutdown Point "A" 11) Label the Inflection Point "B" 12) Mark the Boundary between Stages I and II with a Vertical Line 13) If the best Price the Seller can temporarily charge is $15, how much $ can he/she pay the Bank $ and how much $ does he/she still owe the Bank \$ this year
Step by Step Solution
There are 3 Steps involved in it
Step: 1
Get Instant Access to Expert-Tailored Solutions
See step-by-step solutions with expert insights and AI powered tools for academic success
Step: 2
Step: 3
Ace Your Homework with AI
Get the answers you need in no time with our AI-driven, step-by-step assistance
Get Started