

Question
Draw a graph showing the prices at expiry of a fiduciary call and another one showing a protective put, including all of their components, in
Draw a graph showing the prices at expiry of a fiduciary call and another one showing a protective put, including all of their components, in relation to the price of the stock in a range between 350p and 600p.
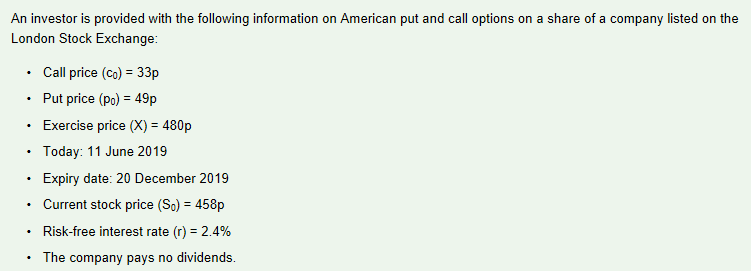
An investor is provided with the following information on London Stock Exchange: American put and call options on a share of a company listed on the Call price (co) 33p Put price (Po) 49p Exercise price (X) = 480p Today: 11 June 2019 Expiry date: 20 December 2019 Current stock price (So) 458p Risk-free interest rate (r) 2.4% The company pays no dividendsStep by Step Solution
There are 3 Steps involved in it
Step: 1

Get Instant Access to Expert-Tailored Solutions
See step-by-step solutions with expert insights and AI powered tools for academic success
Step: 2

Step: 3
Ace Your Homework with AI
Get the answers you need in no time with our AI-driven, step-by-step assistance
Get Started
Corporate Finance Governance And Business Cycles Theory And International Comparisons
Authors: Robert E. Krainer
1st Edition
0444510494, 9780444510495