Answered step by step
Verified Expert Solution
Question
1 Approved Answer
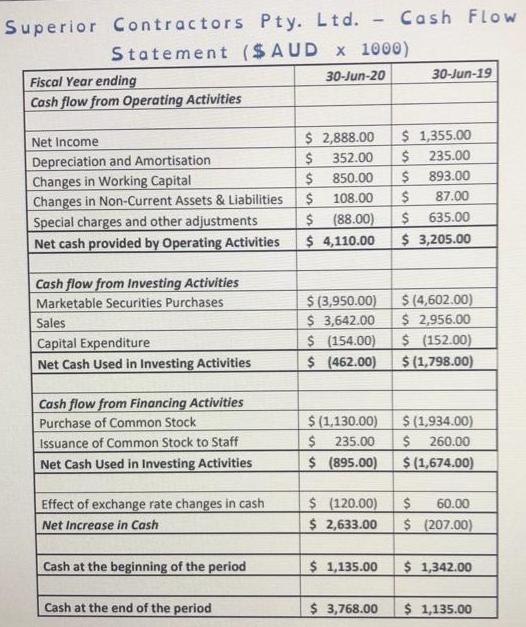
Draw cash flow diagram for the following table Superior Contractors Pty. Ltd. Cash Flow Statement ($AUD x 1000) 30-Jun-20 30-Jun-19 Fiscal Year ending Cash


Draw cash flow diagram for the following table Superior Contractors Pty. Ltd. Cash Flow Statement ($AUD x 1000) 30-Jun-20 30-Jun-19 Fiscal Year ending Cash flow from Operating Activities $ 2,888.00 $ 352.00 $ 850.00 $ 108.00 $ 1,355.00 Net Income Depreciation and Amortisation Changes in Working Capital Changes in Non-Current Assets & Liabilities Special charges and other adjustments Net cash provided by Operating Activities 235.00 $ 893.00 87.00 $ (88.00) $ 4,110.00 $ 635.00 $ 3,205.00 Cash flow from Investing Activities Marketable Securities Purchases $ (3,950.00) $ 3,642.00 $ (154.00) $ (462.00) $ (4,602.00) $ 2,956.00 $ (152.00) $ (1,798.00) Sales Capital Expenditure Net Cash Used in Investing Activities Cash flow from Financing Activities Purchase of Common Stock $ (1,130.00) $ (1,934.00) Issuance of Common Stock to Staff 235.00 2$ 260.00 Net Cash Used in Investing Activities $(895.00) $(1,674.00) Effect of exchange rate changes in cash Net Increase in Cash $ (120.00) $ 2,633.00 60.00 $ (207.00) Cash at the beginning of the period $ 1,135.00 $ 1,342.00 Cash at the end of the period $ 3,768.00 $ 1,135.00
Step by Step Solution
★★★★★
3.40 Rating (153 Votes )
There are 3 Steps involved in it
Step: 1
Cash Flow Diagram 5000 3642 3768 4000 2888 3000 2000 1135 850 1000 352 108 235 88 ...
Get Instant Access to Expert-Tailored Solutions
See step-by-step solutions with expert insights and AI powered tools for academic success
Step: 2

Step: 3

Ace Your Homework with AI
Get the answers you need in no time with our AI-driven, step-by-step assistance
Get Started


