Answered step by step
Verified Expert Solution
Question
1 Approved Answer
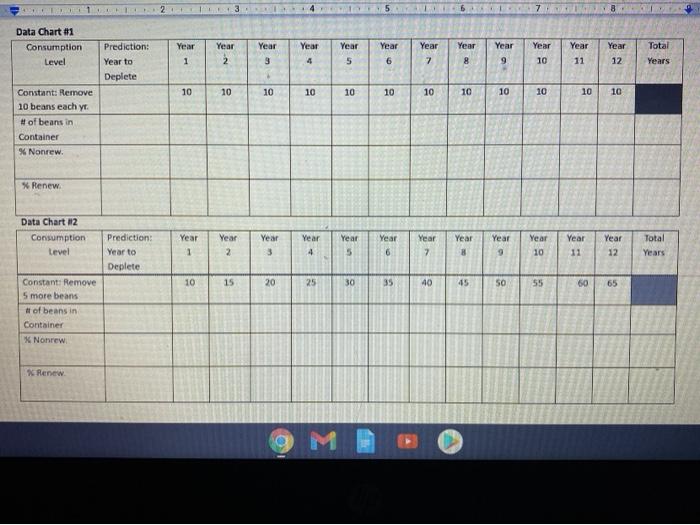
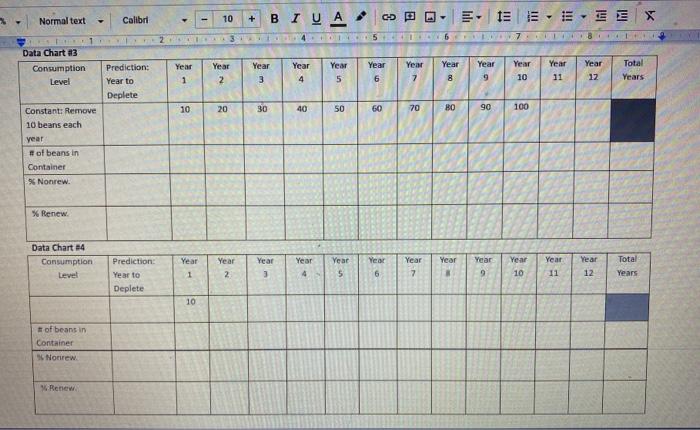
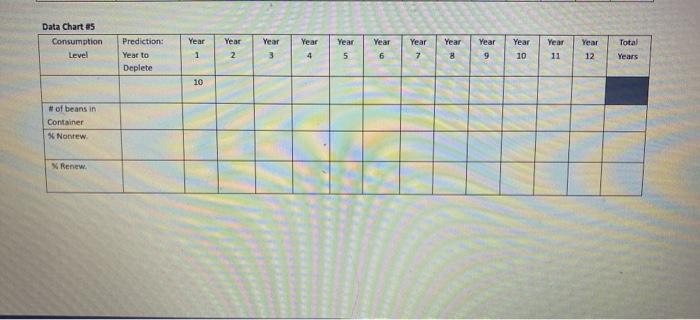
DRAW CHART This chart tells you how many beans to draw out of the container depending on the energy consumption rate you choose to simulate.
DRAW CHART
This chart tells you how many beans to draw out of the container depending on the energy consumption rate you choose to simulate. Before beginning each year, predict how long it will take to remove all NONRENEWABLE beans. Complete the chart by recording the number of all.
RULES:
1. Remove only the number of beans indicated on your chart.
2. Always remove 10 beans in the first year.
3. Put renewable beans back in the container after each pull. count ONLY the beans left in the container. NOTE: You may not be able to fill in all the boxes to year 12; or you may have to extend this chart on the back!
4. The student pulling the beans out must be properly blindfolded. Consider it cheating if you pull beans based on how they feel.
5. Keep all beans where they can be counted and returned to the jar
Explanation to practice problem 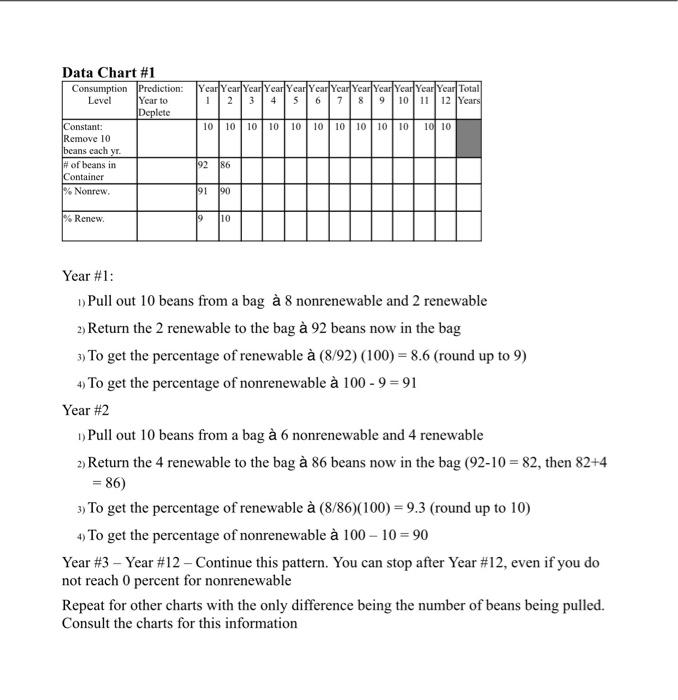
12 3. Data Chart 01 Consumption Level Year Year Year Year Year Year Total Prediction: Year to Deplete Year 2 Year 3 Year 8 Year 9 Year 10 Year 11 1 5 6 7 12 Years 10 10 10 10 10 10 10 10 10 10 10 10 Constant: Remove 10 beans each y # of beans in Container % Nonrew * Renew. Data Chart 2 Consumption Level Year Year Prediction: Year to Deplete Year 2 Year 3 Year 5 Year 6 Year 7 Year 8 Year 9 Year 10 Year 11 Year 12 Total Years 1 4 10 15 20 25 30 35 40 45 50 55 60 65 Constant Remove 5 more beans # of beans in Container * Nonrew Renew Normal text Calibri 10 + BIU A ODPO- , 13 EE-EE 2 3 4 5 6 7 Data Chart 83 Consumption Level Year Year Year Year 1 Year 2 Year 3 Prediction: Year to Deplete Year 4 Year 5 Year 7 Year 9 Year 10 Year 12 Total Years 6 8 11 10 20 30 40 50 60 70 90 100 Constant: Remove 10 beans each year of beans in Container Nonrew. % Renew Data Chart 24 Consumption Level Year Year Year Total Year 1 Prediction Year to Deplete Year 2 Year 4 Year 5 Year 7 Year 9 Year 10 Year 11 Year 12 6 Years 10 of beans in Container Nonrew Renew Data Chart 5 Consumption Level Year Year Year Total Prediction: Year to Deplete Year 1 Year 3 Year 4 Year 5 Year 7 Year 8 Year 10 Year 11 Year 12 2 6 9 Years 10 # of beans in Container Nonte Renew Data Chart #1 Consumption Prediction Year Year Year Year YearYear Year YearYear Year Year Year Total Level Year to 12345678 9 10 11 12 Years Deplete Constant: 10 10 10 10 10 10 10 10 10 10 10 10 Remove 10 beans each yr. # of beans in 92 86 Container % Nonrew. 190 191 % Renew. 19 10 Year #1: 1) Pull out 10 beans from a bag 8 nonrenewable and 2 renewable 2) Return the 2 renewable to the bag 92 beans now in the bag 3) To get the percentage of renewable (8/92) (100) = 8.6 (round up to 9) 4) To get the percentage of nonrenewable 100 - 9=91 Year #2 1) Pull out 10 beans from a bag 6 nonrenewable and 4 renewable 2) Return the 4 renewable to the bag 86 beans now in the bag (92-10 = 82, then 82+4 =86) 3) To get the percentage of renewable (8/86)(100) = 9.3 (round up to 10) 4) To get the percentage of nonrenewable 100 - 10 = 90 Year #3 - Year #12 - Continue this pattern. You can stop after Year #12, even if you do not reach 0 percent for nonrenewable Repeat for other charts with the only difference being the number of beans being pulled. Consult the charts for this information 12 3. Data Chart 01 Consumption Level Year Year Year Year Year Year Total Prediction: Year to Deplete Year 2 Year 3 Year 8 Year 9 Year 10 Year 11 1 5 6 7 12 Years 10 10 10 10 10 10 10 10 10 10 10 10 Constant: Remove 10 beans each y # of beans in Container % Nonrew * Renew. Data Chart 2 Consumption Level Year Year Prediction: Year to Deplete Year 2 Year 3 Year 5 Year 6 Year 7 Year 8 Year 9 Year 10 Year 11 Year 12 Total Years 1 4 10 15 20 25 30 35 40 45 50 55 60 65 Constant Remove 5 more beans # of beans in Container * Nonrew Renew Normal text Calibri 10 + BIU A ODPO- , 13 EE-EE 2 3 4 5 6 7 Data Chart 83 Consumption Level Year Year Year Year 1 Year 2 Year 3 Prediction: Year to Deplete Year 4 Year 5 Year 7 Year 9 Year 10 Year 12 Total Years 6 8 11 10 20 30 40 50 60 70 90 100 Constant: Remove 10 beans each year of beans in Container Nonrew. % Renew Data Chart 24 Consumption Level Year Year Year Total Year 1 Prediction Year to Deplete Year 2 Year 4 Year 5 Year 7 Year 9 Year 10 Year 11 Year 12 6 Years 10 of beans in Container Nonrew Renew Data Chart 5 Consumption Level Year Year Year Total Prediction: Year to Deplete Year 1 Year 3 Year 4 Year 5 Year 7 Year 8 Year 10 Year 11 Year 12 2 6 9 Years 10 # of beans in Container Nonte Renew Data Chart #1 Consumption Prediction Year Year Year Year YearYear Year YearYear Year Year Year Total Level Year to 12345678 9 10 11 12 Years Deplete Constant: 10 10 10 10 10 10 10 10 10 10 10 10 Remove 10 beans each yr. # of beans in 92 86 Container % Nonrew. 190 191 % Renew. 19 10 Year #1: 1) Pull out 10 beans from a bag 8 nonrenewable and 2 renewable 2) Return the 2 renewable to the bag 92 beans now in the bag 3) To get the percentage of renewable (8/92) (100) = 8.6 (round up to 9) 4) To get the percentage of nonrenewable 100 - 9=91 Year #2 1) Pull out 10 beans from a bag 6 nonrenewable and 4 renewable 2) Return the 4 renewable to the bag 86 beans now in the bag (92-10 = 82, then 82+4 =86) 3) To get the percentage of renewable (8/86)(100) = 9.3 (round up to 10) 4) To get the percentage of nonrenewable 100 - 10 = 90 Year #3 - Year #12 - Continue this pattern. You can stop after Year #12, even if you do not reach 0 percent for nonrenewable Repeat for other charts with the only difference being the number of beans being pulled. Consult the charts for this information 
Step by Step Solution
There are 3 Steps involved in it
Step: 1

Get Instant Access to Expert-Tailored Solutions
See step-by-step solutions with expert insights and AI powered tools for academic success
Step: 2

Step: 3

Ace Your Homework with AI
Get the answers you need in no time with our AI-driven, step-by-step assistance
Get Started


