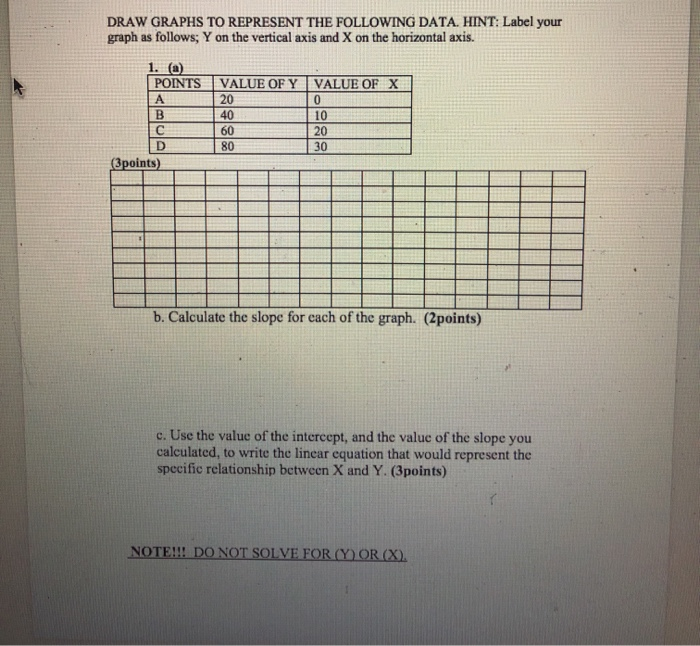
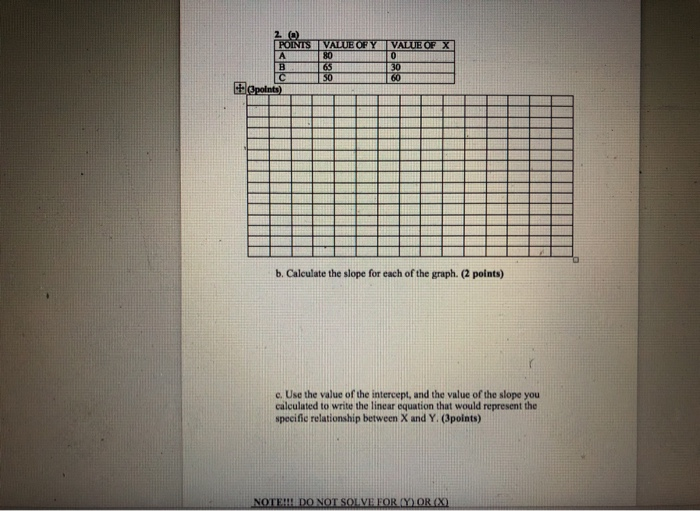
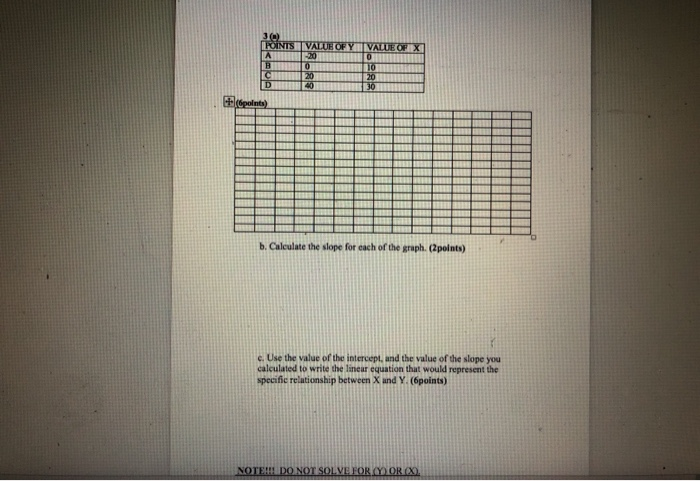
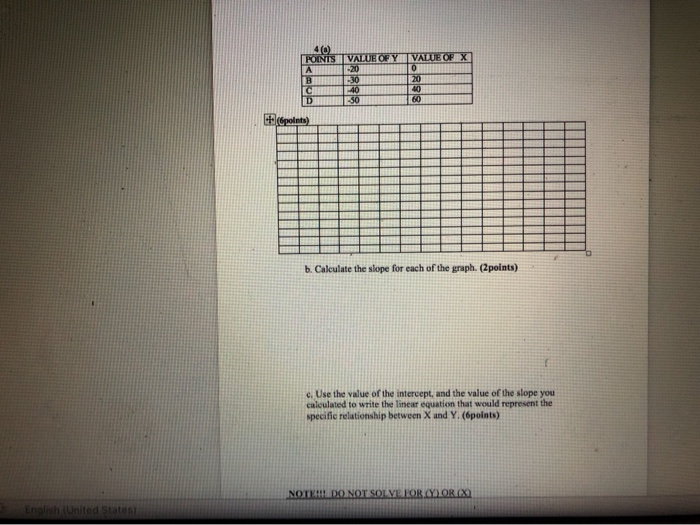
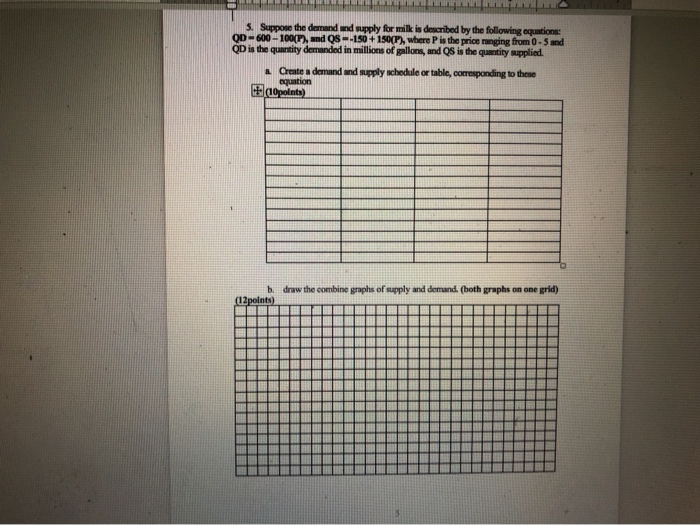
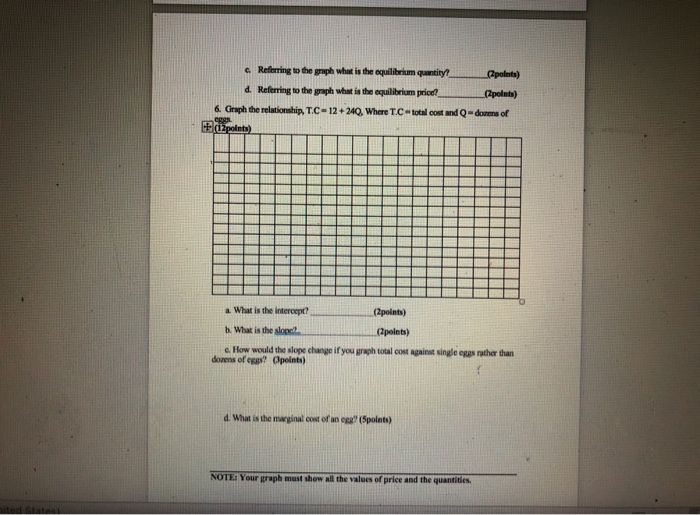
DRAW GRAPHS TO REPRESENT THE FOLLOWING DATA. HINT: Label your graph as follows; Y on the vertical axis and X on the horizontal axis. 1. (a) POINTS VALUE OF Y VALUE OF X A 40 60 10 20 30 (3points) b. Calculate the slope for cach of the graph. (2points) c. Use the value of the intercept, and the value of the slope you calculated, to write the linear equation that would represent the specific relationship between X and Y. (3points) NOTE!!! DO NOT SOLVE FOR (Y) OR (X) BCDS 2. (a) POINTS VALUBOF Y 80 65 50 VALUE OF X 0 A 30 HOpoints) b. Calculate the slope for each of the graph. (2 points) c. Use the value of the intercept, and the value of the slope you calculated to write the linear equation that would represent the specific relationship between X and Y. (3points) NOTE!!! DO NOT SOLVE FOR (Y) OR (X) 3(0) FOINTS VALUH OF Y 20 VALUE OF X 20 40 20 D 30 b. Calculate the slope for each of the graph. (2points) c. Use the value of the intercept, and the value of the slope you calculated to write the linear equation that would represent the specific relationship between X and Y. (6points) NOTE!! DO NOT SOLVE FOR CY) OR (X) 5. Suppose the demand and supply for milk is described by the following equations OD-600-100(P), and QS--150+150(P), where P is the price nanging from 0-5 and OD is the quantity demanded in millions of gallons, and QS is the quantity supplied a Create a demand and supply achedule or table, coresponding to these equation aopolnts) draw the combine graphs of supply and demand. (both graphs on one grid) b. (12points) Referring to the graph what is the equilibrium quantity? (2polnts) d. Referring to the graph what is the equilibrium price? (2polnts) 6. Graph the relationship, T.C-12+ 240, Where T.C total cost and Q-dozens of cggs. ipolnts) a What is the intercept? (2points) b. What is the slone (2points) c How would the slope change if you graph total cost against single eggs rather than donms of eggs? Opoints) d. What is the marginal cost of an egg? (5points) NOTE: Your graph must show all the values of price and the quantities
