Answered step by step
Verified Expert Solution
Link Copied!

Question

1 Approved Answer

draw the histogram for iris(python ) 2]: # graph the histogram and pdf of the alcohol feature of the wine_df data wine_df['alcohol'] wine_df['alcohol'].mean() sigma =

draw the histogram for iris(python ) image text in transcribed
2]: # graph the histogram and pdf of the alcohol feature of the wine_df data wine_df['alcohol'] wine_df['alcohol'].mean() sigma = wine_df['alcohol'].std) mu X- plt.hist(data, bins=25, density=True, alpha=0.6, color='r') xmin, xmax - plt.xlim) np. linspace(xmin, xmax, len(data)) params stats.norm.pdf (x, loc=mu, scale-sigma) plt.plot(x, params, 'k', linewidth-2) plt.show() 0.6 0.5 0.4 03 02 0.1 0.0 12 13 14 15 NOTE That doesn't look much like a norm distribution and there are tests that we can use to determine if it is In [ ]: # your turn to graph the histogram and pdf of the sepal Length (cm) # data- iris_df ['sepal Length (cm)

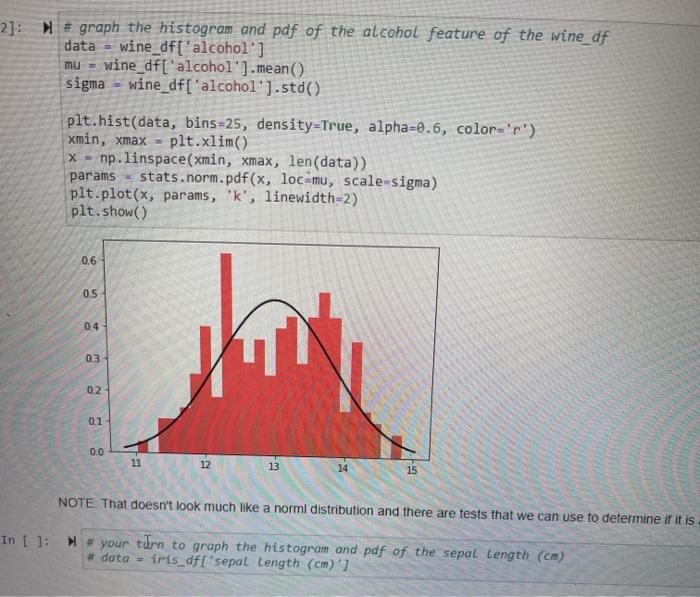
Step by Step Solution

There are 3 Steps involved in it

Step: 1

blur-text-image

Get Instant Access to Expert-Tailored Solutions

See step-by-step solutions with expert insights and AI powered tools for academic success

Step: 2

blur-text-image

Step: 3

blur-text-image

Ace Your Homework with AI

Get the answers you need in no time with our AI-driven, step-by-step assistance

Get Started

Recommended Textbook for

Concepts Of Database Management

Authors: Joy L. Starks, Philip J. Pratt, Mary Z. Last

9th Edition

1337093424, 978-1337093422

Students also viewed these Databases questions

Question

How many Tables Will Base HCMSs typically have? Why?

Answered: 1 week ago

Question

What is the process of normalization?

Answered: 1 week ago