

Answered step by step
Verified Expert Solution
Question
1 Approved Answer
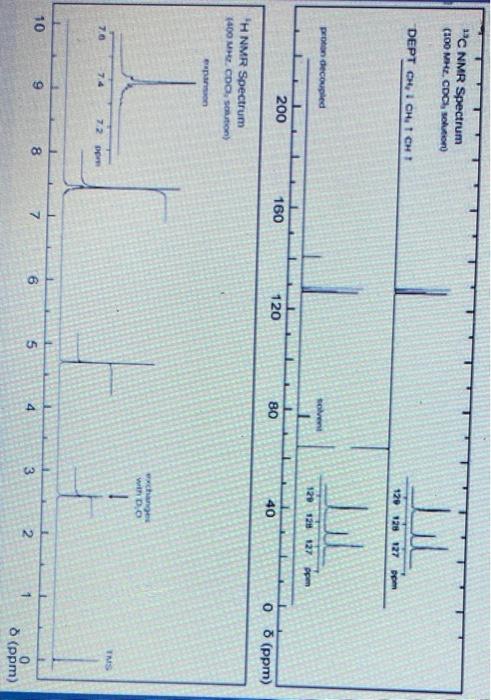
Draw the structure and name the compound that is shown from the following data. please explain how the answer was obtained. Anna 3026 IR Spectrum
Draw the structure and name the compound that is shown from the following data. please explain how the answer was obtained. 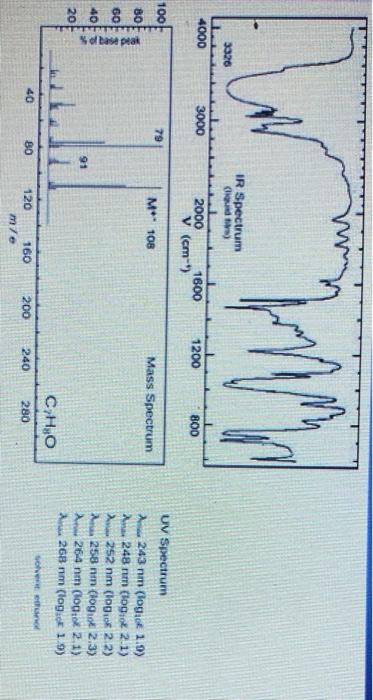
Step by Step Solution
There are 3 Steps involved in it
Step: 1

Get Instant Access to Expert-Tailored Solutions
See step-by-step solutions with expert insights and AI powered tools for academic success
Step: 2

Step: 3
Ace Your Homework with AI
Get the answers you need in no time with our AI-driven, step-by-step assistance
Get Started
Macroscale And Microscale Organic Experiments
Authors: Kenneth L Williamson, Robert Minard, Katherine M Masters
5th Edition
0618590676, 9780618590674