Answered step by step
Verified Expert Solution
Question
1 Approved Answer
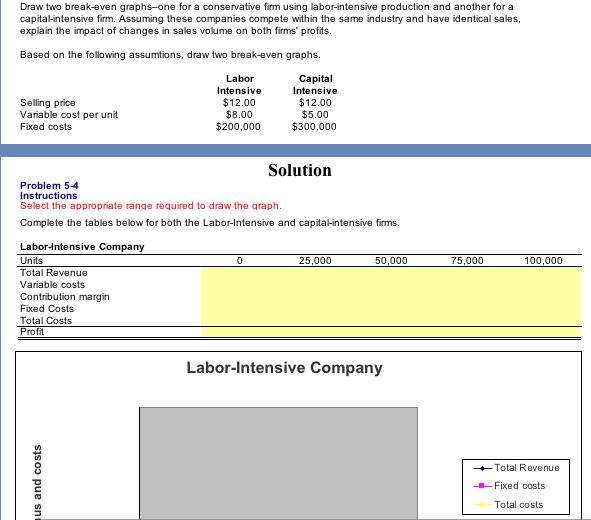
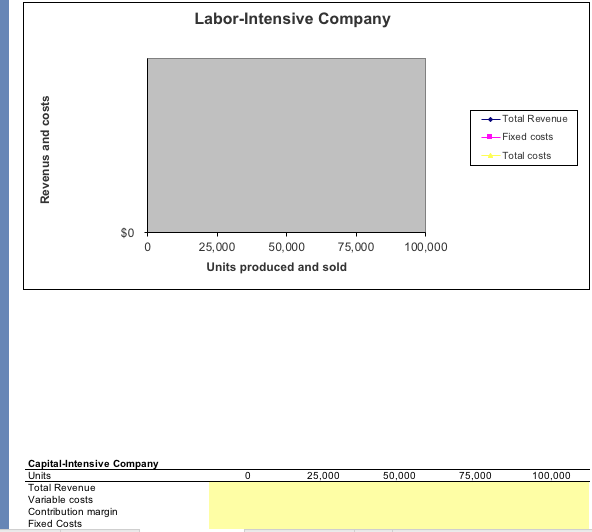
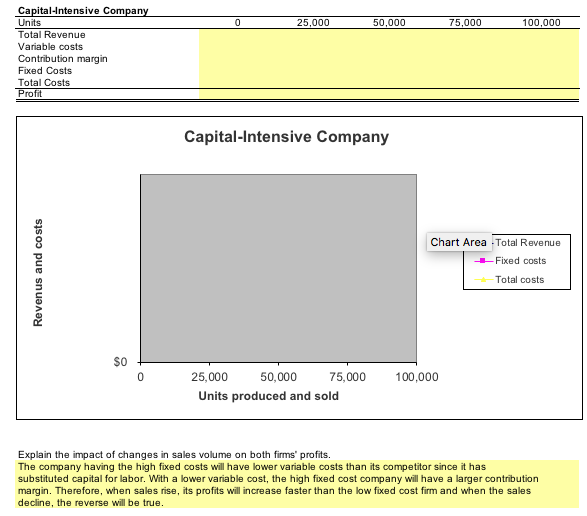
Draw two break-even graphs-one for a conservative firm using labor-intensive production and another for a capitaHintensive firm. Assuming these companies compete within the same industry
Step by Step Solution
There are 3 Steps involved in it
Step: 1

Get Instant Access to Expert-Tailored Solutions
See step-by-step solutions with expert insights and AI powered tools for academic success
Step: 2

Step: 3
Ace Your Homework with AI
Get the answers you need in no time with our AI-driven, step-by-step assistance
Get Started