

Answered step by step
Verified Expert Solution
Question
1 Approved Answer
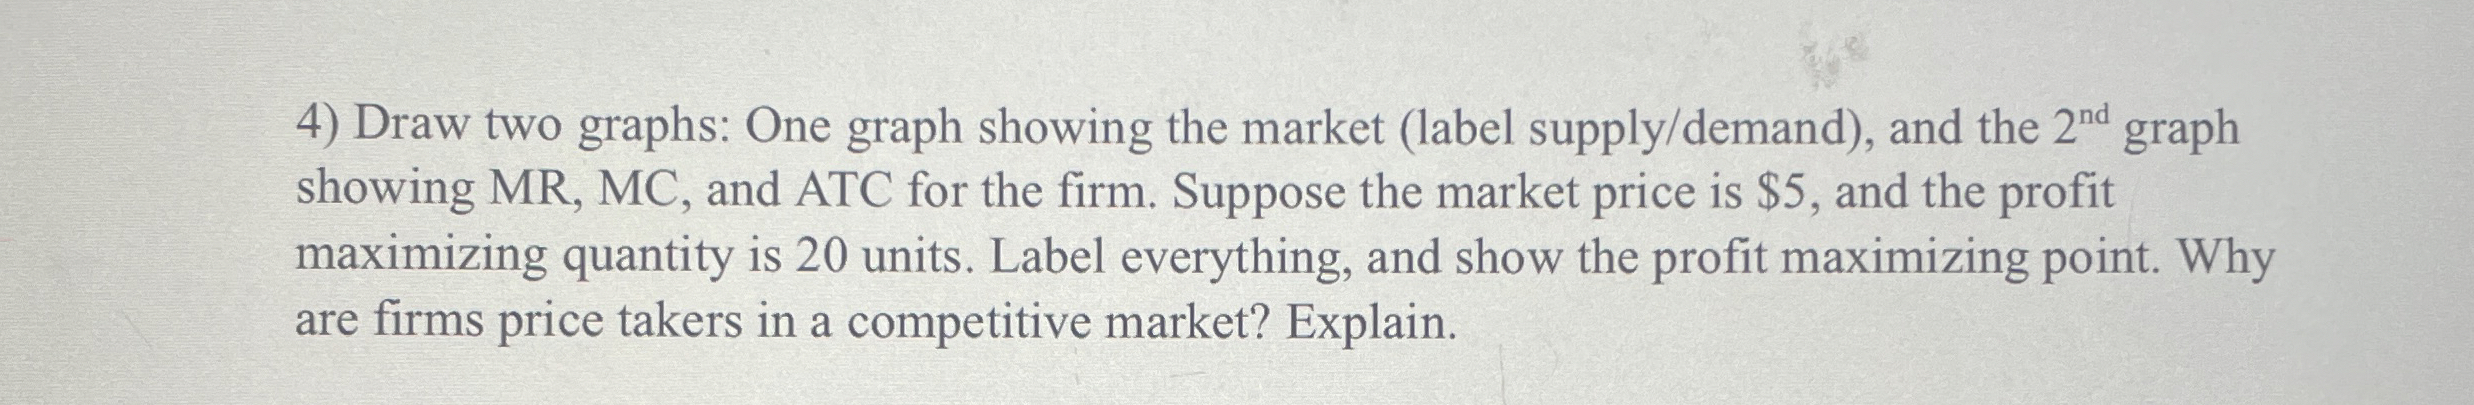
Draw two graphs: One graph showing the market ( label supply / demand ) , and the 2 n d graph showing MR , MC
Draw two graphs: One graph showing the market label supplydemand and the graph showing MR MC and ATC for the firm. Suppose the market price is $ and the profit maximizing quantity is units. Label everything, and show the profit maximizing point. Why are firms price takers in a competitive market? Explain.
Step by Step Solution
There are 3 Steps involved in it
Step: 1

Get Instant Access to Expert-Tailored Solutions
See step-by-step solutions with expert insights and AI powered tools for academic success
Step: 2

Step: 3
Ace Your Homework with AI
Get the answers you need in no time with our AI-driven, step-by-step assistance
Get Started
Applied Econometric Time Series
Authors: Walter Enders
4th Edition
1118808568, 9781118808566