

Question
Drawing a yield curve Given the indicated maturities listed in the following table, assume the following yields for US Treasury securities: Maturity (Years) 1 5
 Drawing a yield curve
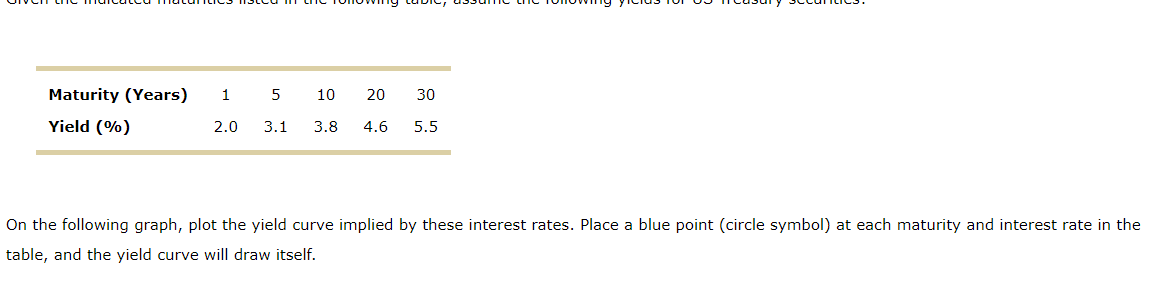
Given the indicated maturities listed in the following table, assume the following yields for US Treasury securities:
| Maturity (Years) | 1 | 5 | 10 | 20 | 30 |
| Yield (%) | 2.0 | 3.1 | 3.8 | 4.6 | 5.5 |
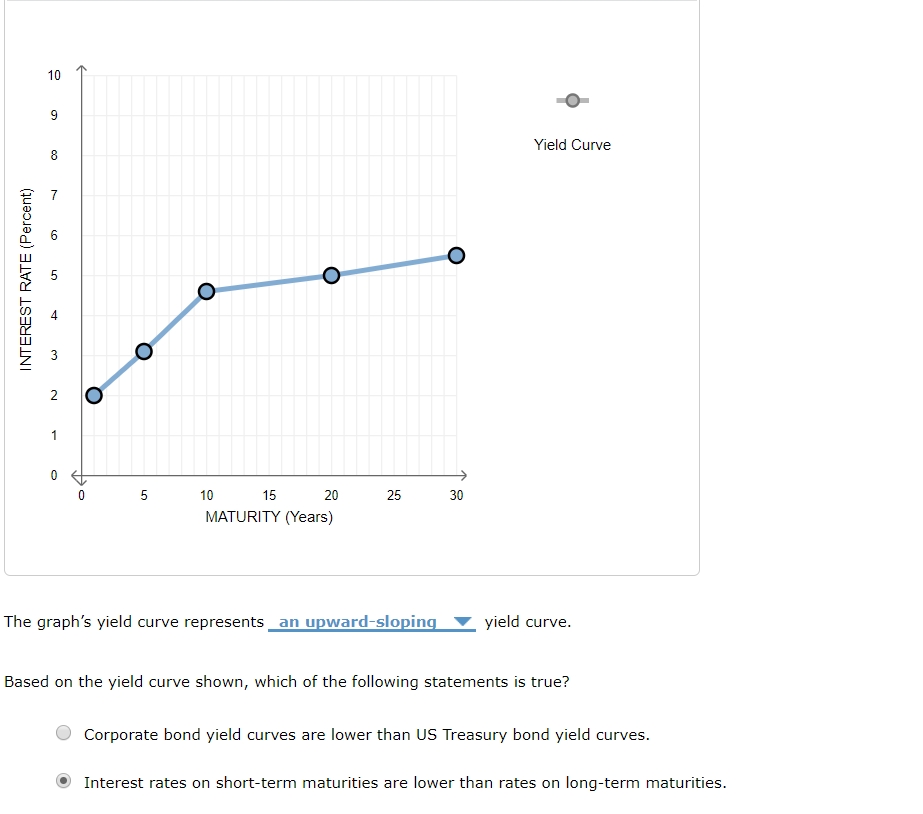
On the following graph, plot the yield curve implied by these interest rates. Place a blue point (circle symbol) at each maturity and interest rate in the table, and the yield curve will draw itself.
Yield Curve051015202530109876543210INTEREST RATE (Percent)MATURITY (Years)
The graphs yield curve representsan upward-sloping yield curve.
Based on the yield curve shown, which of the following statements is true?
Corporate bond yield curves are lower than US Treasury bond yield curves.
Interest rates on short-term maturities are lower than rates on long-term maturities.
PLEASE DRAW THE GRAPH!
UIVCILIC LUCULLU TULUIILILO II SLLUT LIICIUNUVVILTY LUDIC, UDIUL LIIC TUHUVITY YILIUS IULUJII CUSUI Y SLUTILICU. Maturity (Years) Yield (%) 1 2.0 5 3.1 10 3.8 20 4.6 30 5.5 On the following graph, plot the yield curve implied by these interest rates. Place a blue point (circle symbol) at each maturity and interest rate in the table, and the yield curve will draw itself. O Yield Curve INTEREST RATE (Percent) o 5 - 25 30 10 15 20 MATURITY (Years) The graph's yield curve represents an upward-sloping yield curve. Based on the yield curve shown, which of the following statements is true? O Corporate bond yield curves are lower than US Treasury bond yield curves. Interest rates on short-term maturities are lower than rates on long-term maturities. UIVCILIC LUCULLU TULUIILILO II SLLUT LIICIUNUVVILTY LUDIC, UDIUL LIIC TUHUVITY YILIUS IULUJII CUSUI Y SLUTILICU. Maturity (Years) Yield (%) 1 2.0 5 3.1 10 3.8 20 4.6 30 5.5 On the following graph, plot the yield curve implied by these interest rates. Place a blue point (circle symbol) at each maturity and interest rate in the table, and the yield curve will draw itself. O Yield Curve INTEREST RATE (Percent) o 5 - 25 30 10 15 20 MATURITY (Years) The graph's yield curve represents an upward-sloping yield curve. Based on the yield curve shown, which of the following statements is true? O Corporate bond yield curves are lower than US Treasury bond yield curves. Interest rates on short-term maturities are lower than rates on long-term maturitiesStep by Step Solution
There are 3 Steps involved in it
Step: 1

Get Instant Access to Expert-Tailored Solutions
See step-by-step solutions with expert insights and AI powered tools for academic success
Step: 2

Step: 3
Ace Your Homework with AI
Get the answers you need in no time with our AI-driven, step-by-step assistance
Get Started
Broadcasting Finance In Transition
Authors: Jay G. Blumler, T. J. Nossiter
1st Edition
0195050894, 978-0195050899