

Question
(Drawing an implied volatility graph) Find options on S&P 500 index. There are multiple versions of S&P500 such as SPX or SPY, and you can
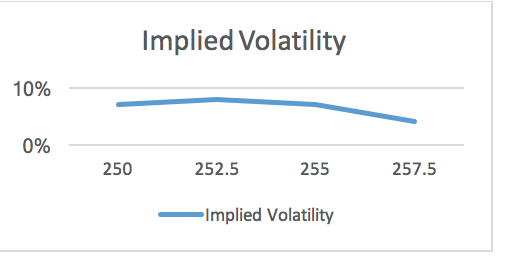
(Drawing an implied volatility graph) Find options on S&P 500 index. There are multiple versions of S&P500 such as SPX or SPY, and you can choose any of them you like. Pick 6 call options with different strike prices. The options should have about 1 month to maturity and they should have non-zero volume. Find the implied volatilities of each call option using the market price and Black-Scholes calculator. The implied volatilities can be rounded to 1 digit below zero. Draw a graph of implied volatility. The y-axis should be the implied volatilities you got and the x-axis should be the strike prices you selected. Something like this:
Step by Step Solution
There are 3 Steps involved in it
Step: 1

Get Instant Access to Expert-Tailored Solutions
See step-by-step solutions with expert insights and AI powered tools for academic success
Step: 2

Step: 3
Ace Your Homework with AI
Get the answers you need in no time with our AI-driven, step-by-step assistance
Get Started
Millionaire By Thirty The Quickest Path To Early Financial Independence
Authors: Douglas R. Andrew, Emron Andrew, Aaron Andrew
1st Edition
0446501840, 978-0446501842