

Question: Driving Question | Objective How are the graphs of position versus time, velocity versus time, and acceleration versus time of an object undergoing constant acceleration
![(unless you can do it simulator graphigg mo] digitally) Background Imagine a](https://dsd5zvtm8ll6.cloudfront.net/si.experts.images/questions/2024/09/66f6c2a945bbe_72166f6c2a916b55.jpg)
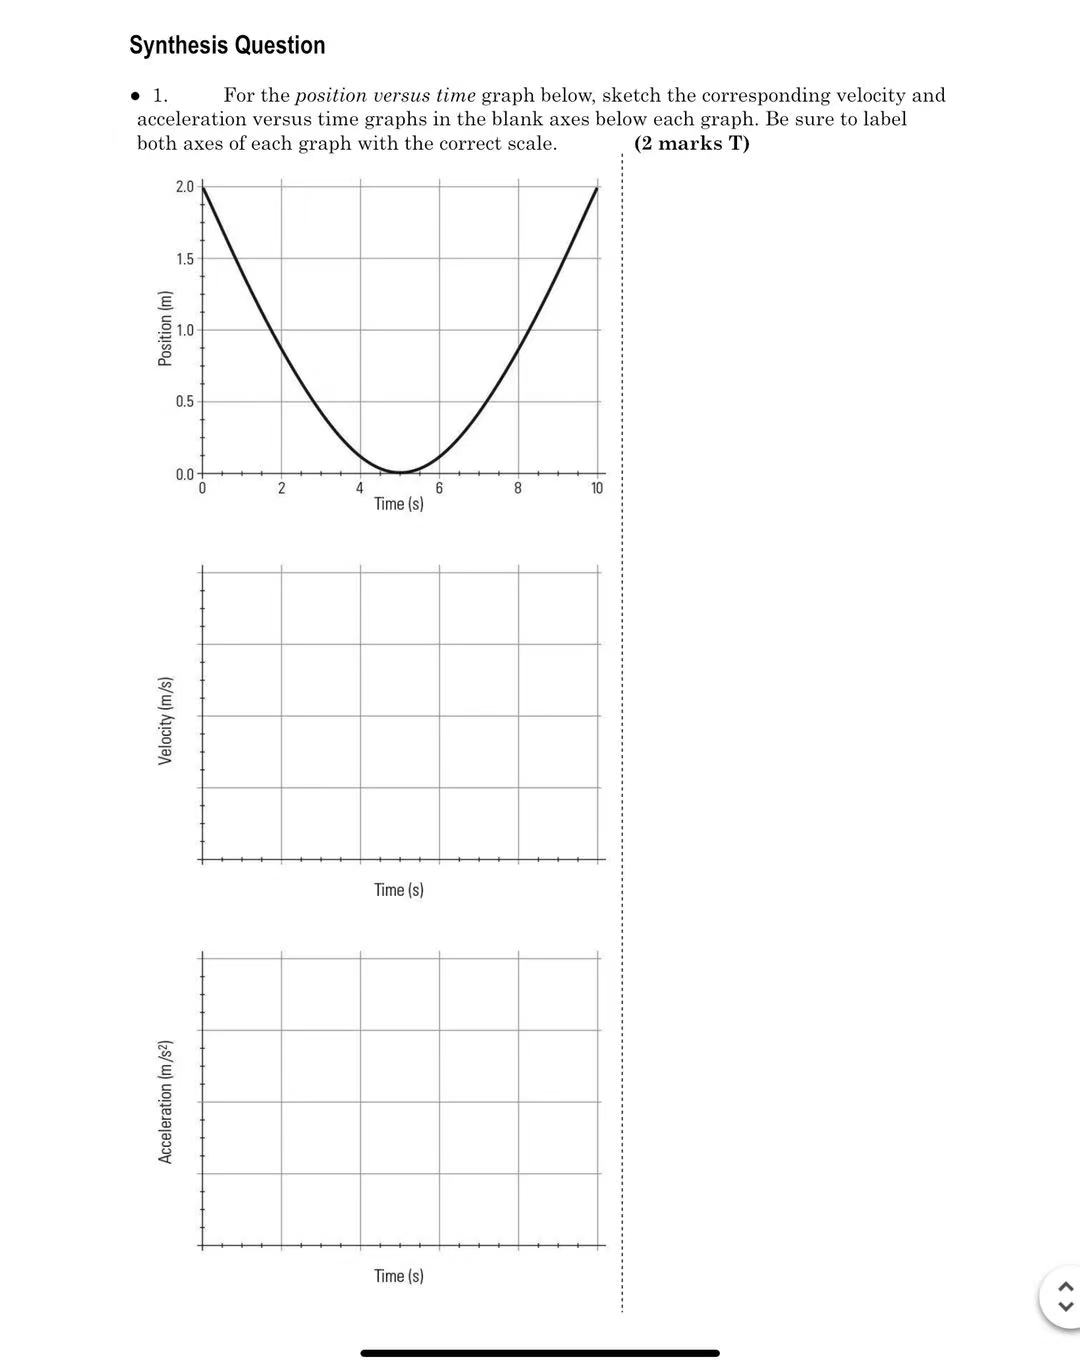
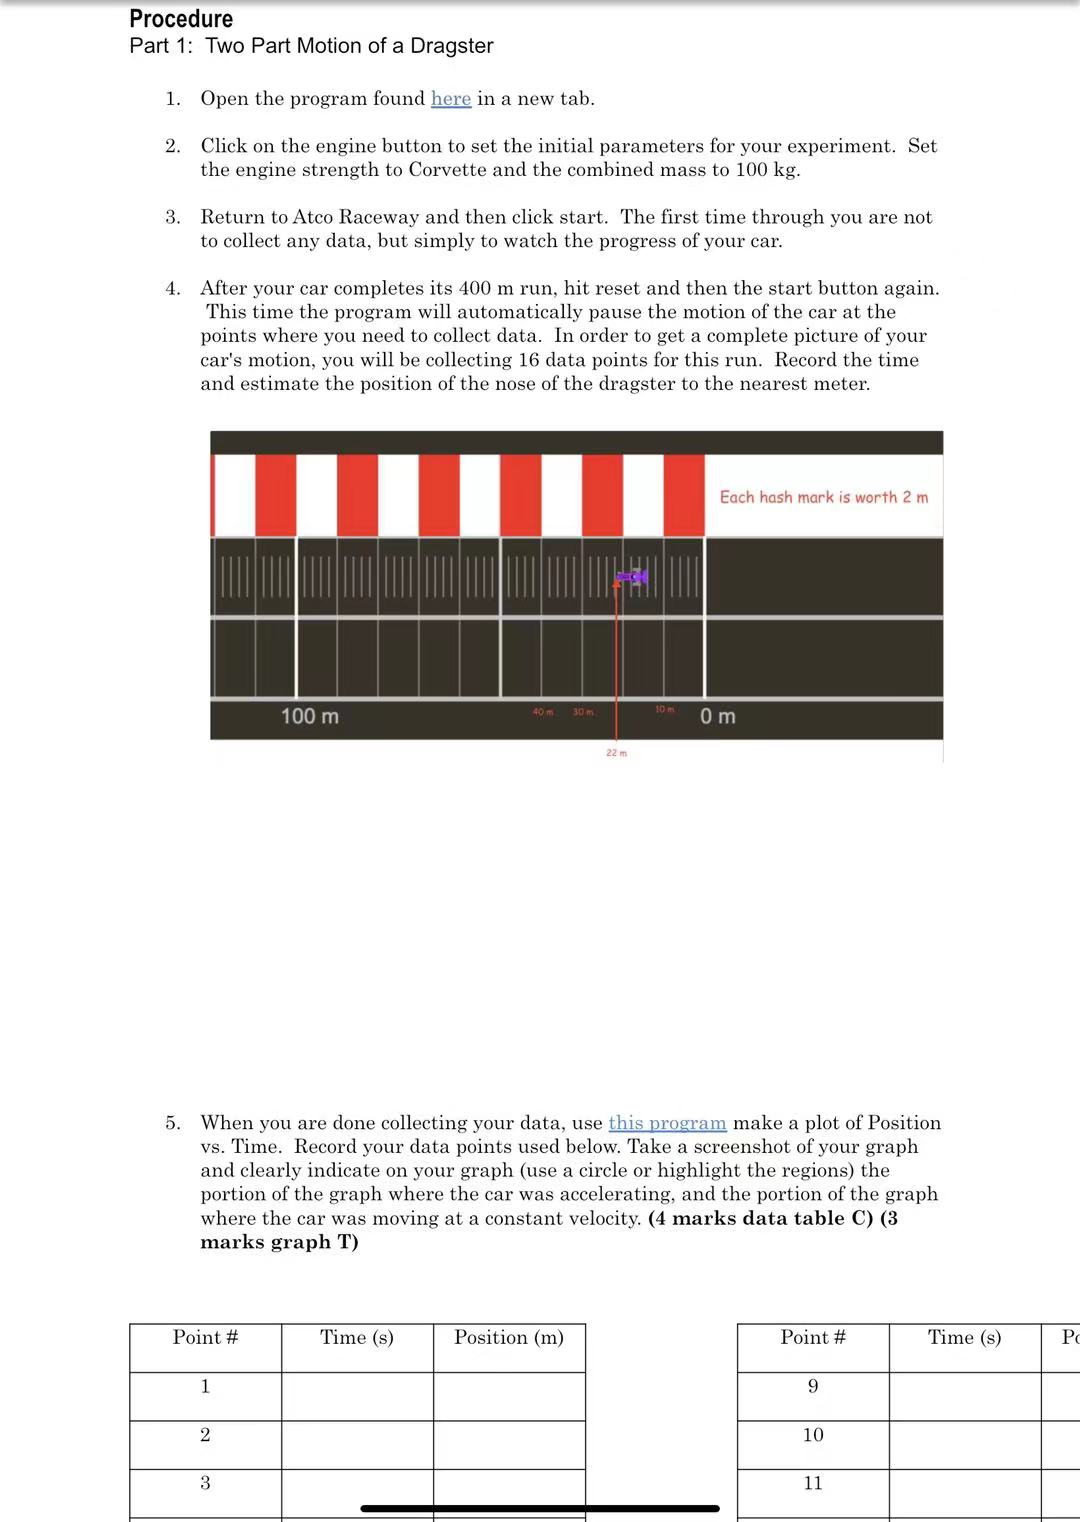
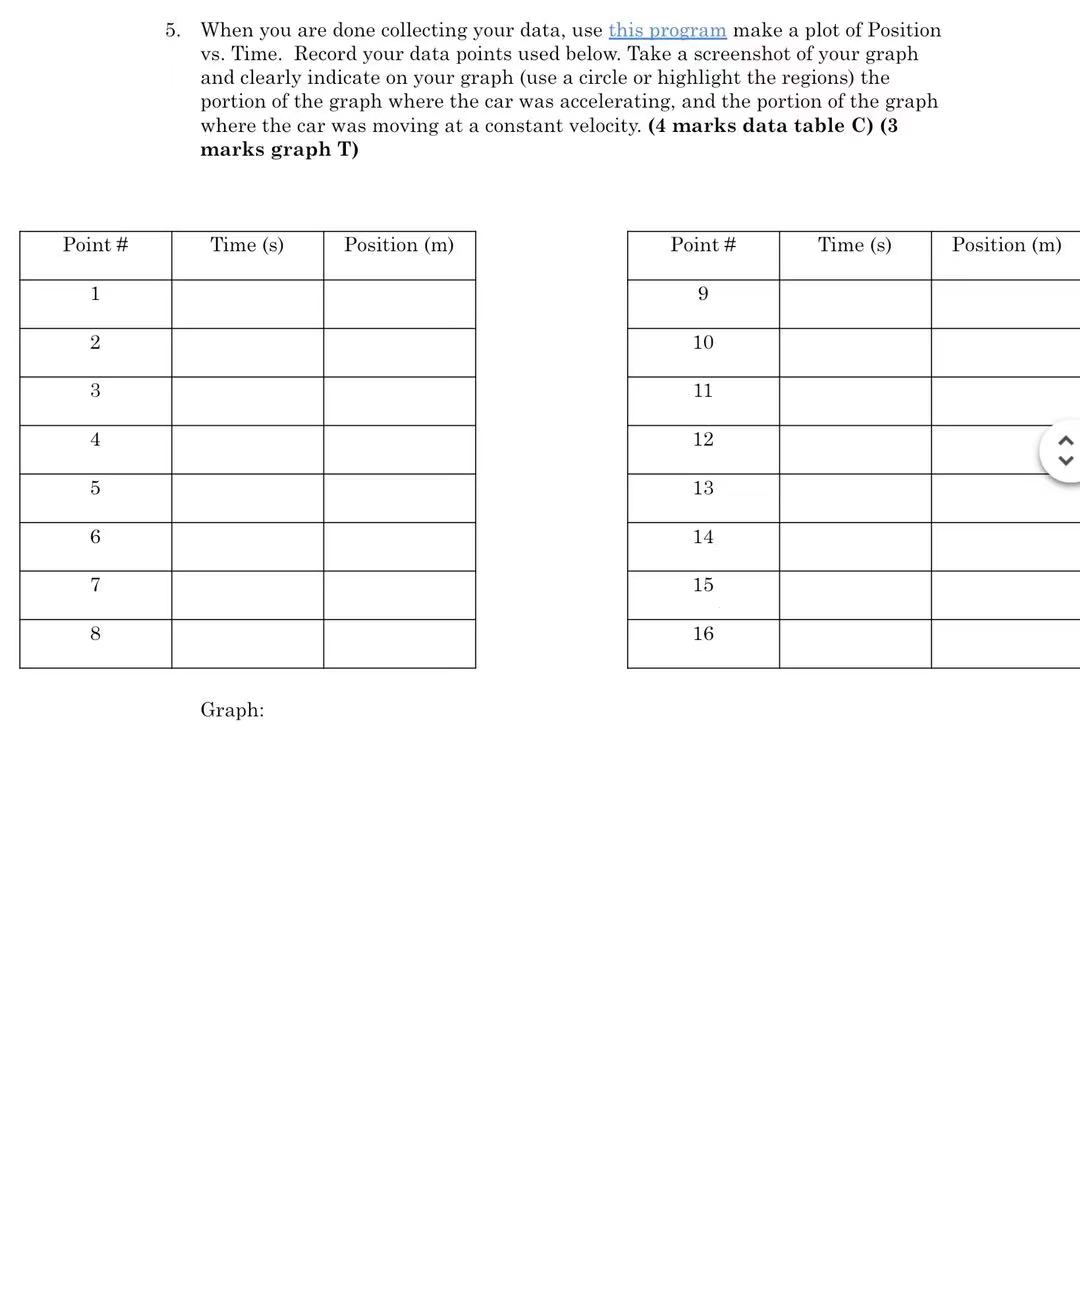
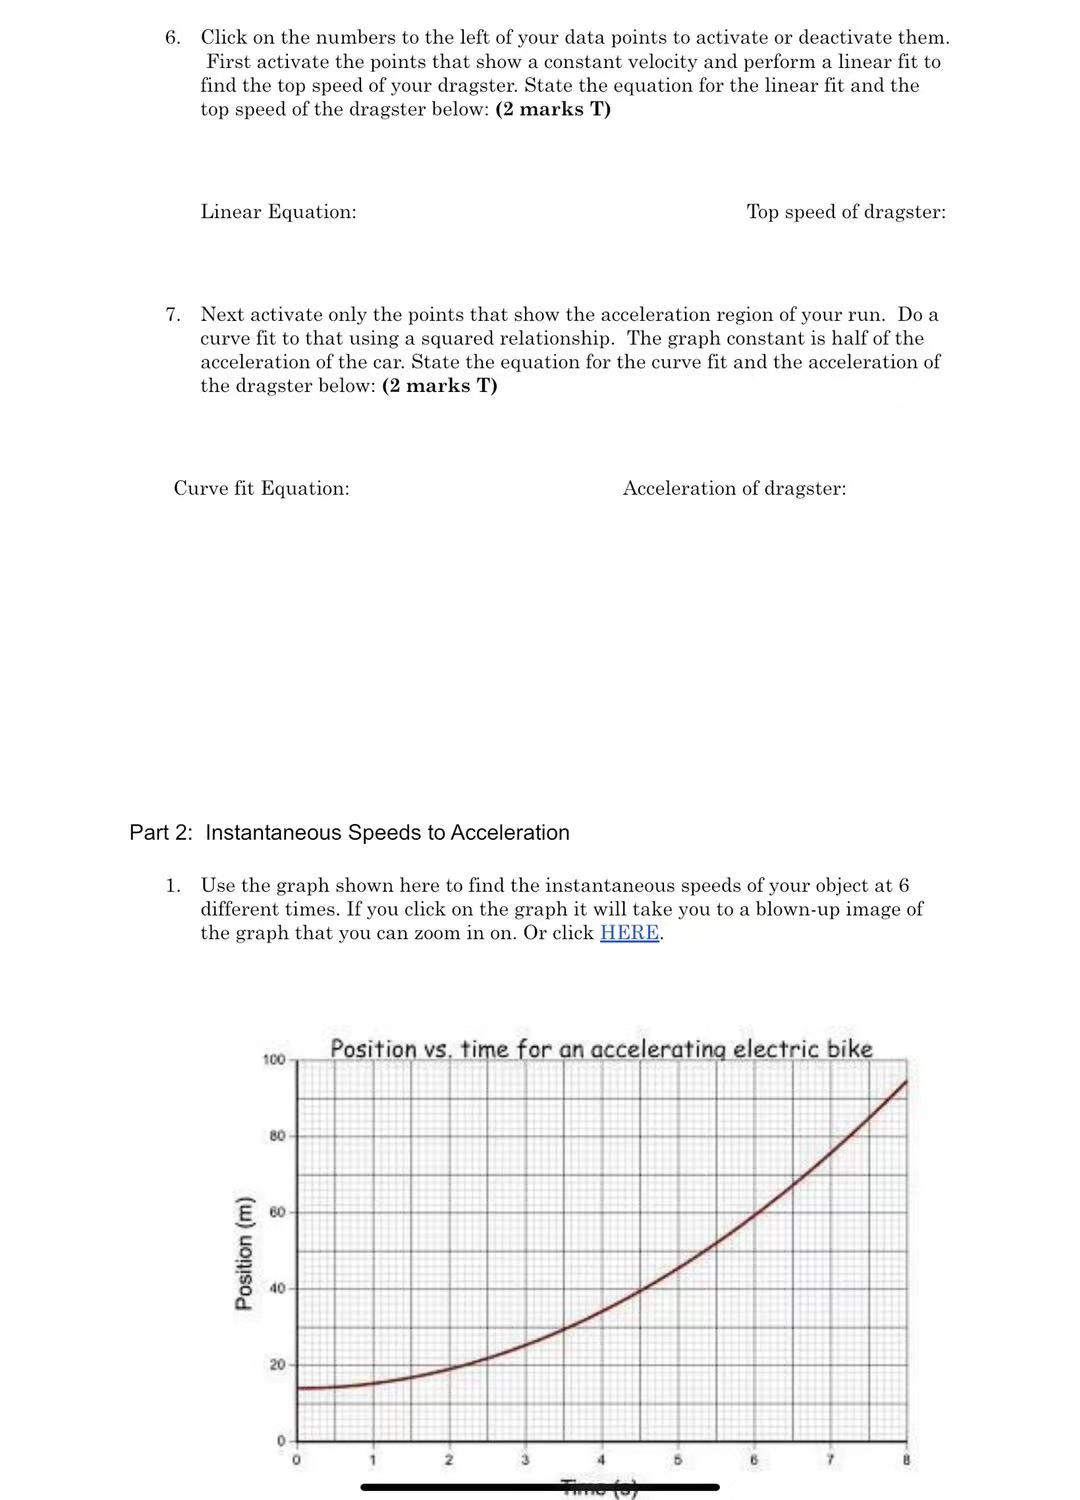
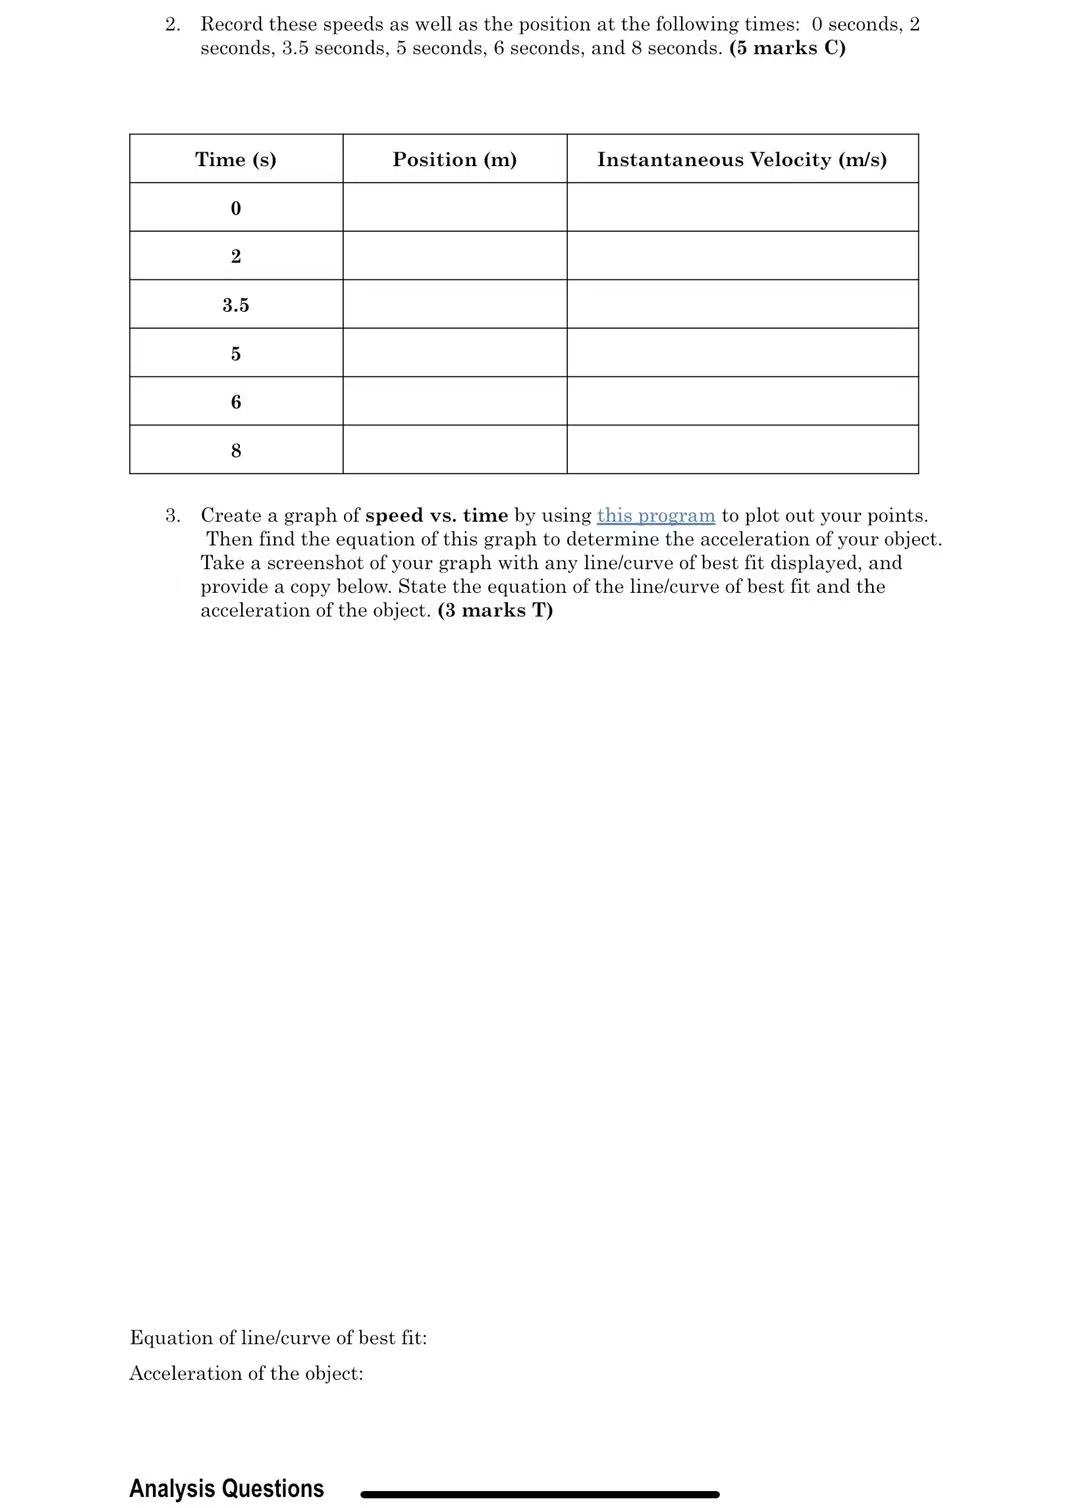
Driving Question | Objective How are the graphs of position versus time, velocity versus time, and acceleration versus time of an object undergoing constant acceleration related? Experimentally determine the relationships between the graphs of position, velocity, and acceleration versus time for an object undergoing constant acceleration. Materials and Equipment Hard copy of pages 1,? for manual . . graphing (unless you can do it simulator graphigg mo] digitally) Background Imagine a car moving down your street at a constant speed of 11 mis (about 40 kmr'h). What does a graph of the car's position x with respect to time i look like? Since it's moving at a constant speed, the graph is a straight line. Its slepe is equal to the car's velocity I). So What does a graph of velocity versus time look like? At a constant 11 W5, velocity is a straight, at line. What is the slope of a at line? Zero. And what does this example show? It shows that since the car's velocity is not changing, the car is not accelerating, so the slope of a velocity versus time graph is equal to acceleration a. Position, velocity, and acceleration versus time graphs for a car moving with constant velocity: ._ 3:27 s E. 5 \"*~ i: gt E ((81 tisi tiSi PRE-LAB Question: Draw the position-time, velocity-time and acceleration-time graphs for a car moving with a constant positive acceleration. A sketch is acceptable, no scale required. (3 marks T) Procedure Part 1: Two Part Motion of a Dragster 1. 2. Open the program found here in a new tab. Click on the engine button to set the initial parameters for your experiment. Set the engine strength to Corvette and the combined mass to 100 kg. Return to Atco Raceway and then click start. The rst time through you are not to collect any data, but simply to watch the progress of your car. After your car completes its 400 m run, hit reset and then the start button again. This time the program will automatically pause the motion of the car at the points where you need to collect data. In order to get a complete picture of your car's motion, you will be collecting 16 data points for this run. Record the time and estimate the position of the nose of the dragster to the nearest meter. Each hush mark is worth 2 m 22m When you are done collecting your data, use this program make a plot of Position vs. Time. Record your data points used below. Take a screenshot of your graph and clearly indicate on your graph (use a circle or highlight the regions) the portion of the graph where the car was accelerating, and the portion of the graph where the car was moving at a constant velocity. (4 marks data table C) (3 marks graph T) Position (m) Pt 5. When you are done collecting your data, use this nrogmm make a plot of Position vs. Time. Record your data points used below. Take a screenshot of your graph and clearly indicate on your graph (use a circle or highlight the regions) the portion of the graph where the car was accelerating, and the portion of the graph where the car was moving at a constant velocity. (4 marks data table C) (3 marks graph T) Position (m) (> Graph: 6. Click on the numbers to the left of your data points to activate or deactivate them. First activate the points that show a constant velocity and perform a linear t to. nd the top speed of your dragster. State the equation. for the linear fit and the top speed of the dragster below: (2 marks T) Linear Equation: pr speed of dragster: Next activate only the points that show the acceleration region of your run. Do a curve t to that using a squared relationship. The graph constant is half of the acceleration of the car. State the equation for the curve fit and the acceleration of the dragster below: (2 marks T) Curve t Equation: Acceleration of dragster: Part 2: Instantaneous Speeds to Acceleration 1. Use the graph shown here to find the instantaneous speeds of your object at 6 different times. If you click on the graph it will take you to a blown-up image of the graph that you can zoom in on. Or click HELE- Poaion (m) 8 I I IIIHII III\".- 2. Record these speeds as well as the position at the following times: 0 seconds, 2 seconds, 3.5 seconds, 5 seconds, 6 seconds, and 8 seconds. (5 marks C) Time (s) Position (m) Instantaneous Velocity (m/s) 2 3.5 5 6 8 3. Create a graph of speed vs. time by using this program to plot out your points. Then find the equation of this graph to determine the acceleration of your object. Take a screenshot of your graph with any line/curve of best fit displayed, and provide a copy below. State the equation of the line/curve of best fit and the acceleration of the object. (3 marks T) Equation of line/curve of best fit: Acceleration of the object: Analysis QuestionsEquation of line/curve of best fit: Acceleration of the object: Analysis Questions . 1. Explain the meaning of the slope from both the position versus time and velocity versus time graphs. (2 marks C) . 2. Imagine you were standing in front of a motion sensor which was measuring your position as a function of time as you moved toward (negative direction) or away (positive direction) from the sensor. Assuming the graph below shows this data, describe your motion during data collection in terms of your speed and direction. Be clear with your description using time intervals. (4 marks C) 1.25 1.00- 0.75 Position (m) 0.50 0.25 0.00 0 2 4 6 8 10 12 14 16 18 Time (s)Synthesis Question a 1. For the position versus time graph below, sketch the corresponding velocity and acceleration versus time graphs in the blank axes below each graph. Be sure to label both axes of each graph with the correct scale. ' (2 marks T) 2.9 1.5 E . g : 3% 1.0 l E E 0.5 i o a 4' i D 2 4 5 H 10 : Time [s] E Velocity trufs} Acceleration Inn's?)
Step by Step Solution
There are 3 Steps involved in it

Get step-by-step solutions from verified subject matter experts