

Question
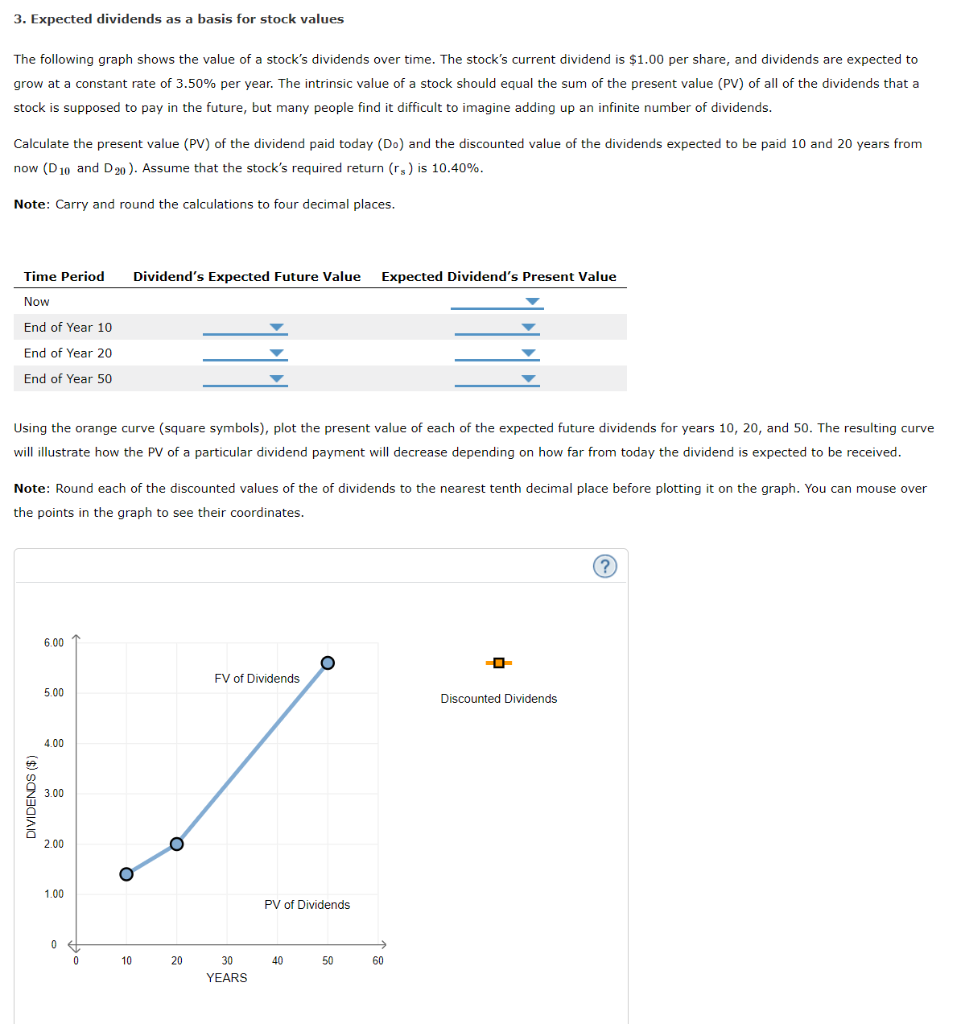
Drop down options: Now expected dividends present value: $1.00/ $0.00/$0.10/$10.00 End of Year 10 Didivdends expected future value: $1.4106/$1.1087/$1.3629/$1.272 End of Year 10 expected dividends
 Drop down options:
Now expected dividends present value: $1.00/ $0.00/$0.10/$10.00
End of Year 10 Didivdends expected future value: $1.4106/$1.1087/$1.3629/$1.272
End of Year 10 expected dividends present value $0.6365/$0.8240/$0.5594/$0.5245
End of Year 20 Didivdends expected future value:$2.0594/$1.7947/$1.9898/$1.9225
End of Year 20 expected dividends present value:$0.2934/ $0.2751/$0.3338/$0.2579
End of Year 50 Didivdends expected future value: $6.1921/$5.7804/$5.5849/$5.3961
End of Year 50 expected dividends present value$0.04233/$0.0397/$0.0372/$0.0327
3. Expected dividends as a basis for stock values The following graph shows the value of a stock's dividends over time. The stock's current dividend is $1.00 per share, and dividends are expected to grow at a constant rate of 3.50% per year. The intrinsic value of a stock should equal the sum of the present value (PV) of all of the dividends that a stock is supposed to pay in the future, but many people find it difficult to imagine adding up an infinite number of dividends. Calculate the present value (PV) of the dividend paid today (Do) and the discounted value of the dividends expected to be paid 10 and 20 years from now (D10 and D20). Assume that the stock's required return (rs) is 10.40%. Note: Carry and round the calculations to four decimal places. Time Period Dividend's Expected Future Value Expected Dividend's Present Value Now End of Year 10 End of Year 20 End of Year 50 Using the orange curve (square symbols), plot the present value of each of the expected future dividends for years 10, 20, and 50. The resulting curve will illustrate how the PV of a particular dividend payment will decrease depending on how far from today the dividend is expected to be received. Note: Round each of the discounted values of the of dividends to the nearest tenth decimal place before plotting it on the graph. You can mouse over the points in the graph to see their coordinates. FV of Dividends Discounted Dividends DIVIDENDS ($) PV of Dividends 0 10 20 40 50 60 30 YEARSStep by Step Solution
There are 3 Steps involved in it
Step: 1

Get Instant Access to Expert-Tailored Solutions
See step-by-step solutions with expert insights and AI powered tools for academic success
Step: 2

Step: 3
Ace Your Homework with AI
Get the answers you need in no time with our AI-driven, step-by-step assistance
Get Started
Urban Public Finance
Authors: D. Wildasin
1st Edition
0415851882, 978-0415851886