

Question
Dry Lab 3 Report sheet Pls help with 2 and check my work thanks 2. analyze each spectrum by locating the most intense wavelengths in
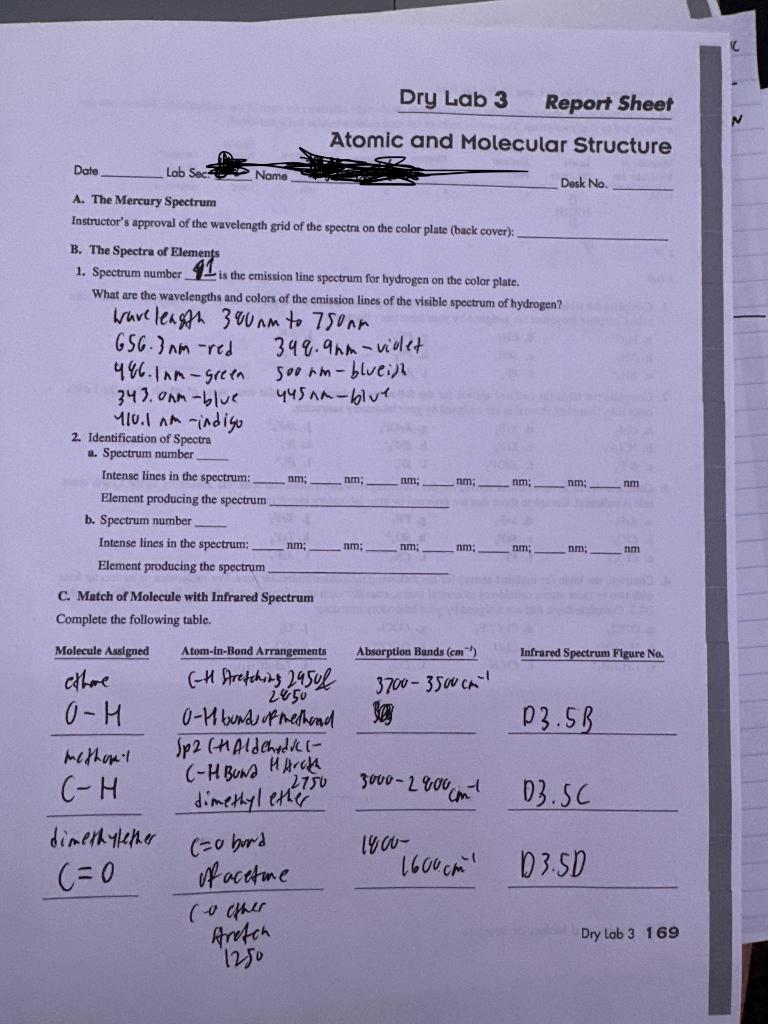
Dry Lab 3 Report sheet
Pls help with 2 and check my work thanks
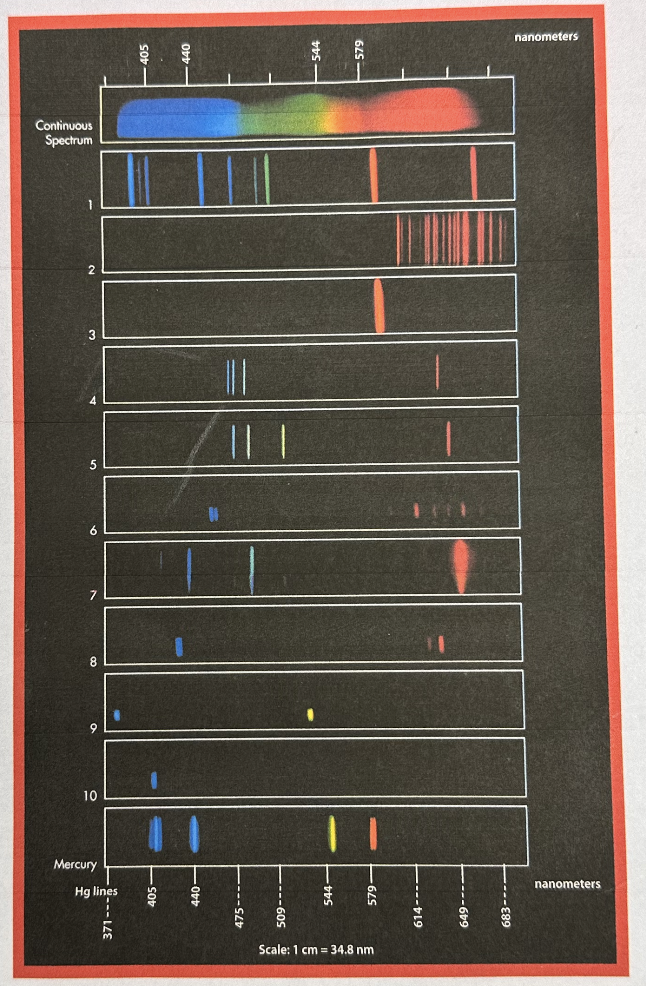
2. analyze each spectrum by locating the most intense wavelengths in the assigned emission spectrum. Compare the wavelengths of the most intense line with the data in Table D3.5. identify the element having the assigned spectrum
Step by Step Solution
There are 3 Steps involved in it
Step: 1

Get Instant Access to Expert-Tailored Solutions
See step-by-step solutions with expert insights and AI powered tools for academic success
Step: 2

Step: 3
Ace Your Homework with AI
Get the answers you need in no time with our AI-driven, step-by-step assistance
Get Started
Quantitative Chemical Analysis
Authors: Daniel C. Harris
9th Edition
146413538X, 978-1464135385