Answered step by step
Verified Expert Solution
Question
1 Approved Answer
A. Objective: The objectives of this exercise are: To examine a message signal, a carrier signal and an AM Single Side Band (SSB) modulated


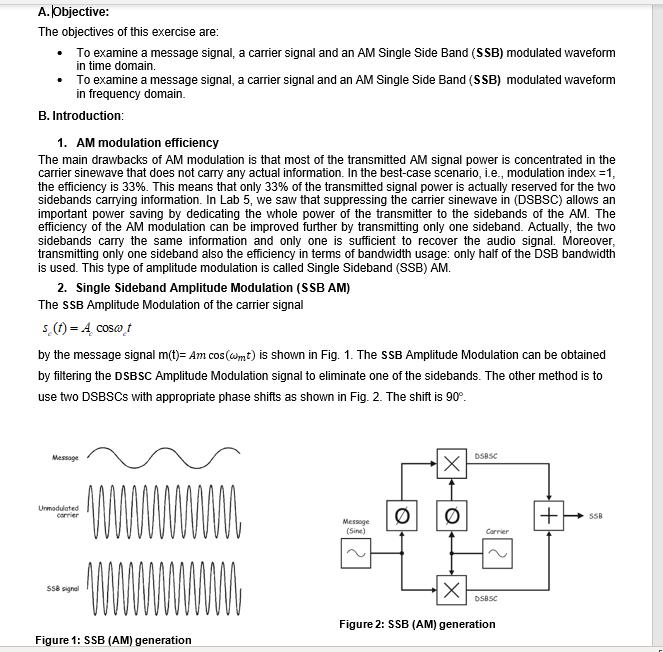
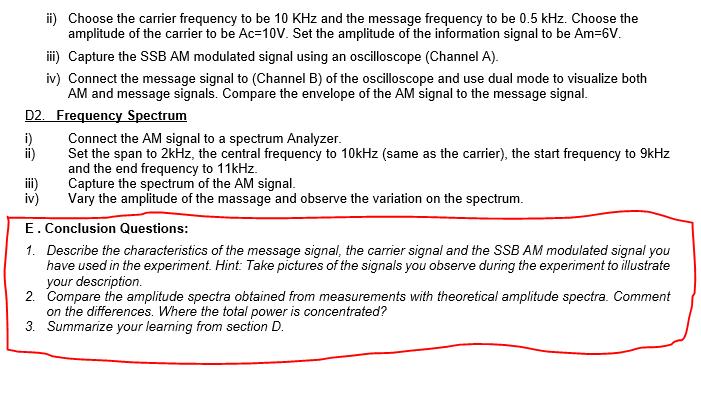
A. Objective: The objectives of this exercise are: To examine a message signal, a carrier signal and an AM Single Side Band (SSB) modulated waveform in time domain. To examine a message signal, a carrier signal and an AM Single Side Band (SSB) modulated waveform in frequency domain. B. Introduction: 1. AM modulation efficiency The main drawbacks of AM modulation is that most of the transmitted AM signal power is concentrated in the carrier sinewave that does not carry any actual information. In the best-case scenario, i.e., modulation index = 1, the efficiency is 33%. This means that only 33% of the transmitted signal power is actually reserved for the two sidebands carrying information. In Lab 5, we saw that suppressing the carrier sinewave in (DSBSC) allows an important power saving by dedicating the whole power of the transmitter to the sidebands of the AM. The efficiency of the AM modulation can be improved further by transmitting only one sideband. Actually, the two sidebands carry the same information and only one is sufficient to recover the audio signal. Moreover, transmitting only one sideband also the efficiency in terms of bandwidth usage: only half of the DSB bandwidth is used. This type of amplitude modulation is called Single Sideband (SSB) AM. 2. Single Sideband Amplitude Modulation (SSB AM) The SSB Amplitude Modulation of the carrier signal s(t) = A cosa t by the message signal m(t)= Am cos (mt) is shown in Fig. 1. The SSB Amplitude Modulation can be obtained by filtering the DSBSC Amplitude Modulation signal to eliminate one of the sidebands. The other method is to use two DSBSCs with appropriate phase shifts as shown in Fig. 2. The shift is 90. Message Unmodulated carrier 558 signal www Figure 1: SSB (AM) generation Message (Sine) Q X X DSBSC Carrier DSBSC Figure 2: SSB (AM) generation + 558 d) Frequency spectrum The amplitude spectrum of the following signal m(t) and the corresponding SSB AM signal are shown in Figure 3. MA 0 791 4 m(t) = m, cos(wm, t) + m cos(wm t) + m cos(wm, t) MA AM modulation S: Ja J Jefa Figure 3: Amplitude of spectral components of SSB AM signal (Lower SideBand) Note the difference with DSB AM. The absence of the carrier sinewave and one of the sidebands in the SSB AM spectrum. Message (Sine) C. Equipment / Components / Resources: i) Multisim If the frequency range of the message signal is from 0 to fs, then, the bandwidth of the message signal, BWm(r) = f3. The corresponding SSB AM modulated signal will occupy a frequency range from f-fa and the bandwidth of the corresponding AM modulated signal is given by: BWm(t) = (fe)-(fe-fa) = BWm(e)- 500 Hz Am-6V lower sideband MA/2 MA/2 mA/2 D. Procedure: D1. Message Signal, Carrier Signal, and DSB SC Signal i) Use MultiSim to build a model for SSB AM modulator base on block diagram below. X X-> D5B5C Jc. Carrier A 10kHz Ac-10V DSBSC B. Adder SSB signal To Ch 2 ii) Choose the carrier frequency to be 10 KHz and the message frequency to be 0.5 kHz. Choose the amplitude of the carrier to be Ac-10V. Set the amplitude of the information signal to be Am=6V. iii) Capture the SSB AM modulated signal using an oscilloscope (Channel A). iii) iv) iv) Connect the message signal to (Channel B) of the oscilloscope and use dual mode to visualize both AM and message signals. Compare the envelope of the AM signal to the message signal. D2. i) ii) Frequency Spectrum Connect the AM signal to a spectrum Analyzer. Set the span to 2kHz, the central frequency to 10kHz (same as the carrier), the start frequency to 9kHz and the end frequency to 11kHz. Capture the spectrum of the AM signal. Vary the amplitude of the massage and observe the variation on the spectrum. E. Conclusion Questions: 1. Describe the characteristics of the message signal, the carrier signal and the SSB AM modulated signal you have used in the experiment. Hint: Take pictures of the signals you observe during the experiment to illustrate your description. 2. Compare the amplitude spectra obtained from measurements with theoretical amplitude spectra. Comment on the differences. Where the total power is concentrated? 3. Summarize your learning from section D.
Step by Step Solution
★★★★★
3.49 Rating (149 Votes )
There are 3 Steps involved in it
Step: 1
Solution 1 The low frequery signal message signd frequency is ...
Get Instant Access to Expert-Tailored Solutions
See step-by-step solutions with expert insights and AI powered tools for academic success
Step: 2

Step: 3

Ace Your Homework with AI
Get the answers you need in no time with our AI-driven, step-by-step assistance
Get Started


