

Answered step by step
Verified Expert Solution
Question
1 Approved Answer
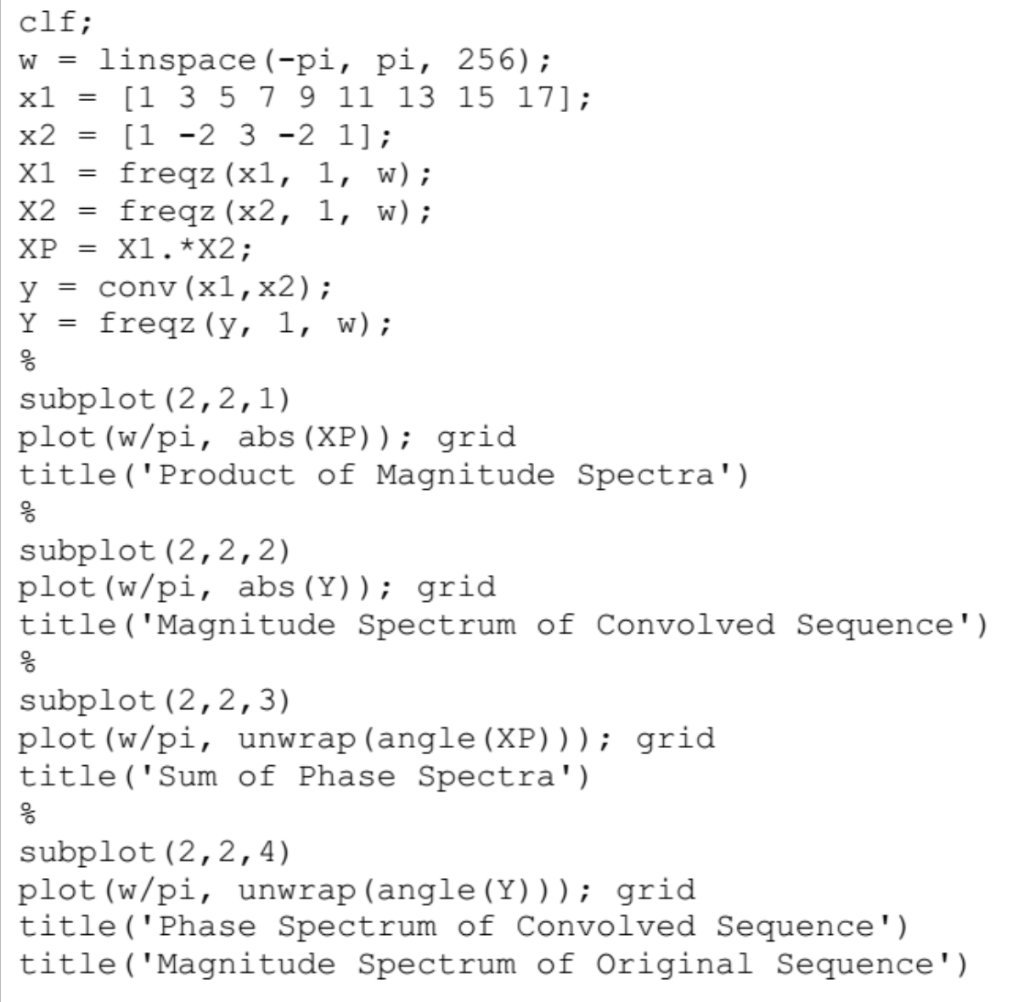
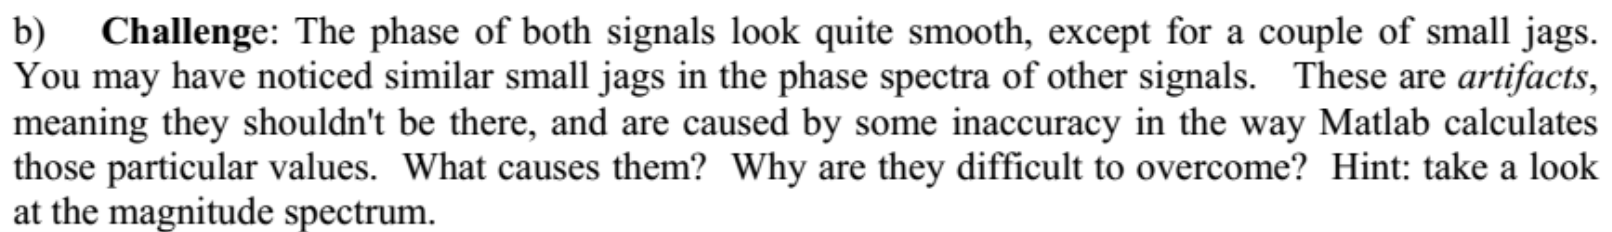
DTFT Convolution property (with detailed explanation) = = = clf; W = linspace (-pi, pi, 256); x1 [1 3 5 7 9 11 13 15
DTFT Convolution property (with detailed explanation)
Step by Step Solution
There are 3 Steps involved in it
Step: 1

Get Instant Access to Expert-Tailored Solutions
See step-by-step solutions with expert insights and AI powered tools for academic success
Step: 2

Step: 3
Ace Your Homework with AI
Get the answers you need in no time with our AI-driven, step-by-step assistance
Get Started
Data Management Databases And Organizations
Authors: Richard T. Watson
6th Edition
1943153035, 978-1943153039