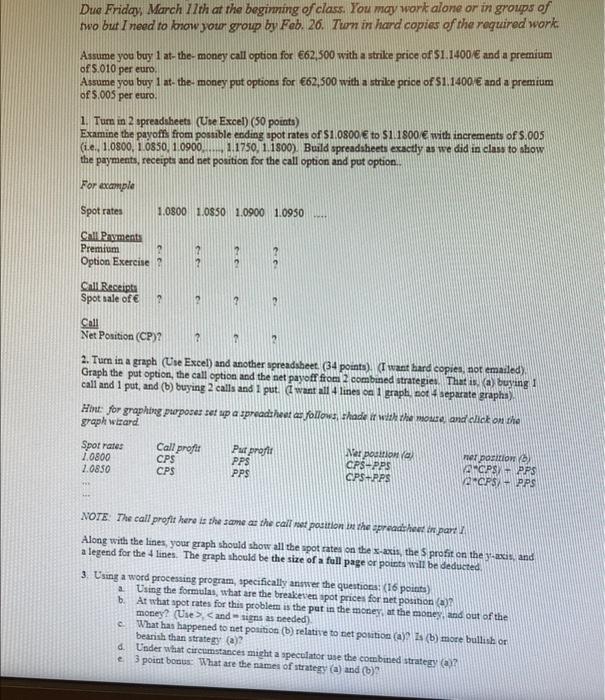
Due Friday, March 17th at the beginning of class. You may work alone or in groups of two but I need to brow your group by Feb. 26. Turn in hard copies of the required work Assume you buy 1 at-the-money call option for 62,500 with a strike price of $1.1400 and a premium of $.010 per euro Assume you buy i at-the-money put options for 62,500 with a strike price of 51.1400 and a premium of 5.005 per euro 1. Tum in 2 spreadsheets (Use Excel) (50 points) Examine the payoffs from possible ending spot rates of $1.0800 to $1.1800 with increments of 5.005 (1.0, 1.0800, 1.0850, 1.0900. ... 1.1750, 1.1800) Build spreadsheets exactly as we did in class to show the payments, receipts and net position for the call option and put option.. For example Spot rates 1.0800 1.0850 1.0900 1.0950 Ca Pavments Premium Option Exercise Call Receipts Spot sale of 2 2 Call Net Position (CP)? 2 2. Turn in a graph (Une Excel) and another spreadsheet. (34 points). I want hard copies, not emailed) Graph the put option, the call option and the net payoff from 2 combined strategies. That is. a) buying 1 call and 1 put, and (b) buying 2 calls and I put. (I want all 4 lines on graph, not 4 separate graphs) Hou for graphing purposes set up a spreadsheet as follows thader with the mouse, and click on the graph weard Call profit Spot rates 1.0800 2.0850 CPS CPS Pur profit PPS PPS Met position ya CPS-PPS CPS+PPS her position) ACPSPPS 2-CP5/- PPS NOTE: The call profit here is the same as the call roet position the spreadsheet be part I Along with the lines your graph should show all the spot rates on the s-acis, the profit on the yacis and a legend for the 4 lines. The graph should be the size of a full page or points will be deducted 3. Using a word processing program, specifically answer the questions: (16 points Using the formulas, what are the breakeves pot prices for net position (1) At what spot rates for this problem is the put in the money, at the money, and out of the money? Use and signs as needed) What has happened to net pouton () relative to net position (a)? Is (b) more bullish or bearish than strategy (a)? . Under what circumstances might a speculator use the combined strategy a 3 point bocus What are the names of strategy (a) and (b) a e Due Friday, March 17th at the beginning of class. You may work alone or in groups of two but I need to brow your group by Feb. 26. Turn in hard copies of the required work Assume you buy 1 at-the-money call option for 62,500 with a strike price of $1.1400 and a premium of $.010 per euro Assume you buy i at-the-money put options for 62,500 with a strike price of 51.1400 and a premium of 5.005 per euro 1. Tum in 2 spreadsheets (Use Excel) (50 points) Examine the payoffs from possible ending spot rates of $1.0800 to $1.1800 with increments of 5.005 (1.0, 1.0800, 1.0850, 1.0900. ... 1.1750, 1.1800) Build spreadsheets exactly as we did in class to show the payments, receipts and net position for the call option and put option.. For example Spot rates 1.0800 1.0850 1.0900 1.0950 Ca Pavments Premium Option Exercise Call Receipts Spot sale of 2 2 Call Net Position (CP)? 2 2. Turn in a graph (Une Excel) and another spreadsheet. (34 points). I want hard copies, not emailed) Graph the put option, the call option and the net payoff from 2 combined strategies. That is. a) buying 1 call and 1 put, and (b) buying 2 calls and I put. (I want all 4 lines on graph, not 4 separate graphs) Hou for graphing purposes set up a spreadsheet as follows thader with the mouse, and click on the graph weard Call profit Spot rates 1.0800 2.0850 CPS CPS Pur profit PPS PPS Met position ya CPS-PPS CPS+PPS her position) ACPSPPS 2-CP5/- PPS NOTE: The call profit here is the same as the call roet position the spreadsheet be part I Along with the lines your graph should show all the spot rates on the s-acis, the profit on the yacis and a legend for the 4 lines. The graph should be the size of a full page or points will be deducted 3. Using a word processing program, specifically answer the questions: (16 points Using the formulas, what are the breakeves pot prices for net position (1) At what spot rates for this problem is the put in the money, at the money, and out of the money? Use and signs as needed) What has happened to net pouton () relative to net position (a)? Is (b) more bullish or bearish than strategy (a)? . Under what circumstances might a speculator use the combined strategy a 3 point bocus What are the names of strategy (a) and (b) a e


