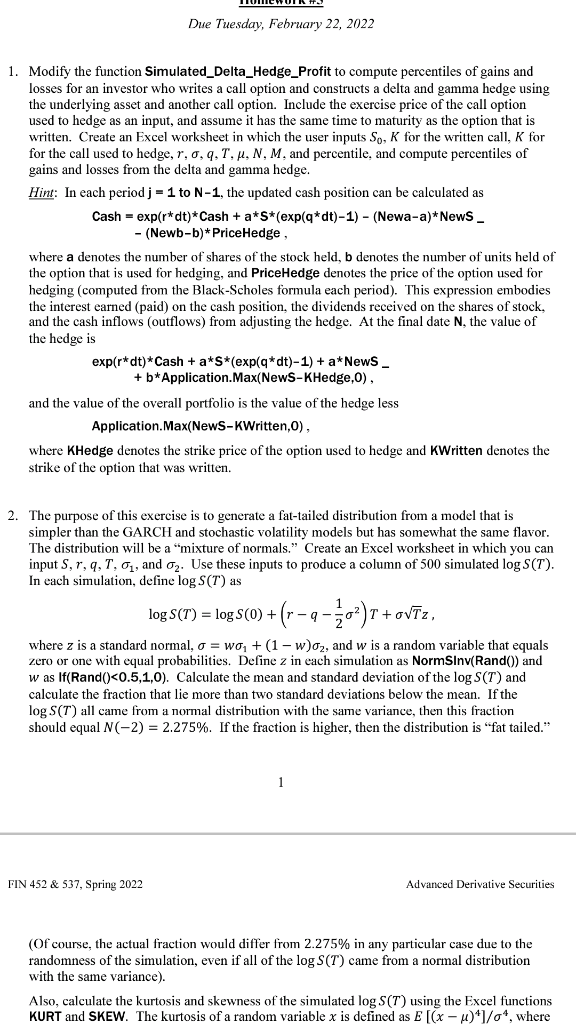
Due Tuesday, February 22, 2022 1. Modify the function Simulated_Delta_Hedge_Profit to compute percentiles of gains and losses for an investor who writes a call option and constructs a delta and gamma hedge using the underlying asset and another call option. Include the exercise price of the call option used to hedge as an input, and assume it has the same time to maturity as the option that is written. Create an Excel worksheet in which the user inputs So, K for the written call, K for for the call used to hedge, r, 0.9.T. J. N. M. and percentile, and compute percentiles of gains and losses from the delta and gamma hedge. Hint: In each period j = 1 to N-1, the updated cash position can be calculated as Cash = exp(r* dt)* Cash + a*S*(exp(q*dt)-1) - (Newa-a)*News_ - (Newb-b)* Price Hedge, where a denotes the number of shares of the stock held, b denotes the number of units held of the option that is used for hedging, and PriceHedge denotes the price of the option used for hedging (computed from the Black-Scholes formula each period). This expression embodies the interest earned (paid) on the cash position, the dividends received on the shares of stock, and the cash inflows outflows) from adjusting the hedge. At the final date the value of the hedge is exp(r*dt)*Cash + a*S*(exp(q* dt)-1) + a*News + b* Application.Max(News-KHedge,0), and the value of the overall portfolio is the value of the hedge less Application. Max(News-KWritten,0), where KHedge denotes the strike price of the option used to hedge and Written denotes the strike of the option that was written. 2. The purpose of this exercise is to generate a fat-tailed distribution from a model that is simpler than the GARCH and stochastic volatility models but has somewhat the same flavor. The distribution will be a "mixture of normals. Create an Excel worksheet in which you can input S, r,q,7, 01, and 02. Use these inputs to produce a column of 500 simulated log S(T). each simulation, define log S(T) as log S(T) = log S(0)+(1 +ovtz, where z is a standard normal, o = wo, + (1 - w), and w is a random variable that equals zero or one with equal probabilities. Define z in each simulation as NormSInv(Rando) and w as If(Rand()


