During one school year, a class of 10 students each took the ACT and SAT college readiness tests. Create your data set: Follow the directions
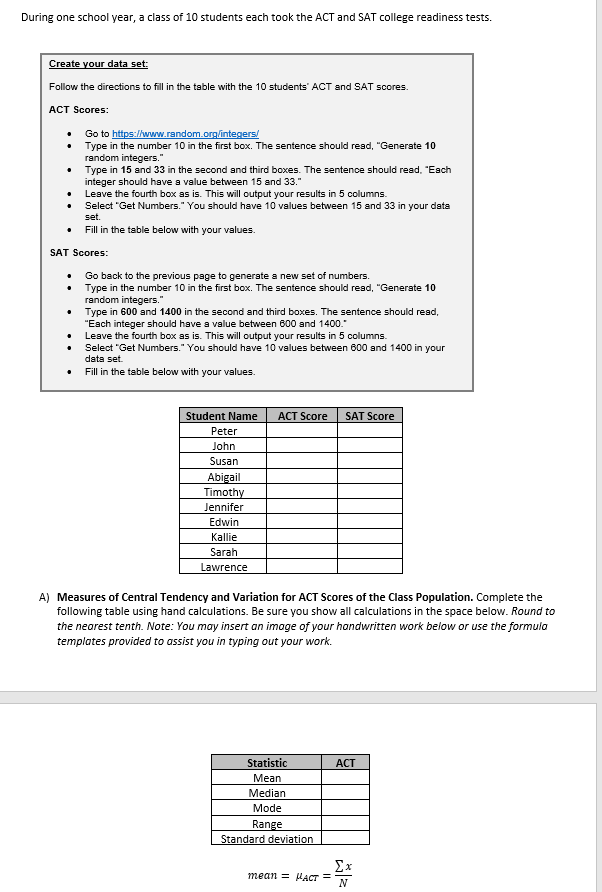
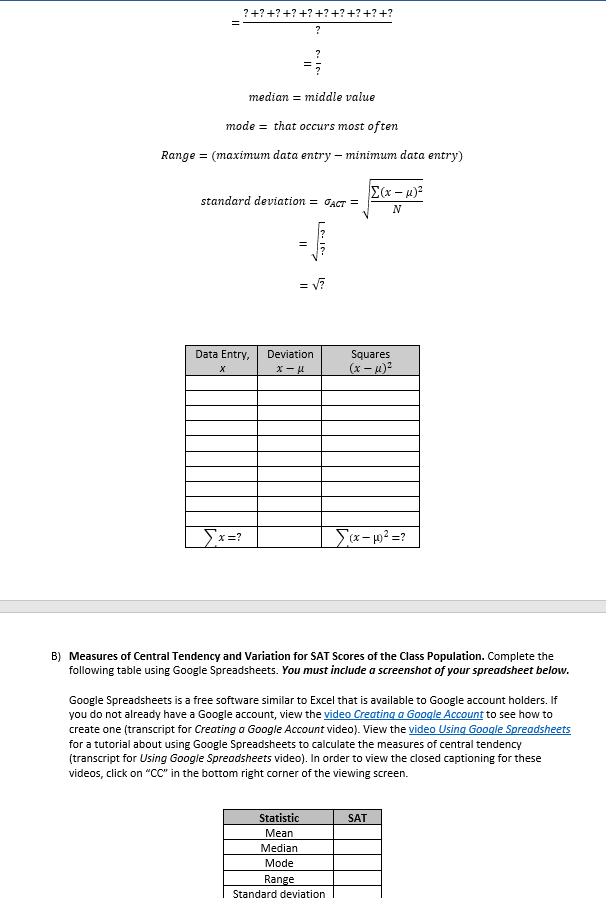
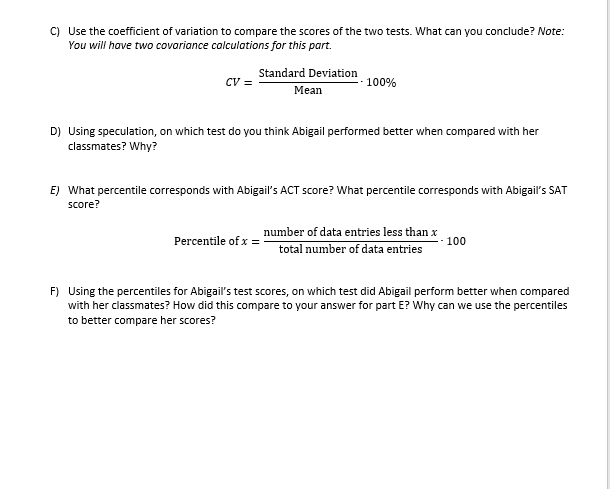
During one school year, a class of 10 students each took the ACT and SAT college readiness tests. Create your data set: Follow the directions to fill in the table with the 10 students' ACT and SAT scores. ACT Scores: Go to https://www.random.org/integers/ Type in the number 10 in the first box. The sentence should read, "Generate 10 random integers." Type in 15 and 33 in the second and third boxes. The sentence should read, "Each integer should have a value between 15 and 33." Leave the fourth box as is. This will output your results in 5 columns. Select "Get Numbers." You should have 10 values between 15 and 33 in your data set. Fill in the table below with your values. SAT Scores: Go back to the previous page to generate a new set of numbers. Type in the number 10 in the first box. The sentence should read, "Generate 10 random integers.' Type in 600 and 1400 in the second and third boxes. The sentence should read, 'Each integer should have a value between 600 and 1400. Leave the fourth box as is. This will output your results in 5 columns. Select "Get Numbers." You should have 10 values between 600 and 1400 in your data set. Fill in the table below with your values. Student Name ACT Score SAT Score Peter lohn Susan Abigail Timothy ennifer Edwin Kallie Sarah Lawrence A) Measures of Central Tendency and Variation for ACT Scores of the Class Population. Complete the following table using hand calculations. Be sure you show all calculations in the space below. Round to the nearest tenth. Note: You may insert on image of your handwritten work below or use the formula templates provided to assist you in typing out your work. Statistic ACT Mean Median Mode Range Standard deviation Ex mean = PAG = N?+?+? +? +? +? +? +?+?+? median = middle value mode = that occurs most often Range = (maximum data entry - minimum data entry) E(x - u)= standard deviation = GACT = = 17 Data Entry, Deviation Squares X X - H (x - 4)2 Sx=? B) Measures of Central Tendency and Variation for SAT Scores of the Class Population. Complete the following table using Google Spreadsheets. You must include a screenshot of your spreadsheet below. Google Spreadsheets is a free software similar to Excel that is available to Google account holders. If you do not already have a Google account, view the video Creating a Google Account to see how to create one (transcript for Creating a Google Account video). View the video Using Google Spreadsheets for a tutorial about using Google Spreadsheets to calculate the measures of central tendency [transcript for Using Google Spreadsheets video). In order to view the closed captioning for these videos, click on "CC" in the bottom right corner of the viewing screen. Statistic SAT Mear Median Mode Range Sta deviationC) Use the coefficient of variation to compare the scores of the two tests. What can you conclude? Note: You will have two covariance calculations for this part. Standard Deviation CV = Mean 100% D) Using speculation, on which test do you think Abigail performed better when compared with her classmates? Why? [) What percentile corresponds with Abigail's ACT score? What percentile corresponds with Abigail's SAT score? number of data entries less than x Percentile of x = 100 total number of data entries F) Using the percentiles for Abigail's test scores, on which test did Abigail perform better when compared with her classmates? How did this compare to your answer for part E? Why can we use the percentiles to better compare her scores
Step by Step Solution
There are 3 Steps involved in it
Step: 1
Get Instant Access to Expert-Tailored Solutions
See step-by-step solutions with expert insights and AI powered tools for academic success
Step: 2
Step: 3
Ace Your Homework with AI
Get the answers you need in no time with our AI-driven, step-by-step assistance