Answered step by step
Verified Expert Solution
Question
1 Approved Answer
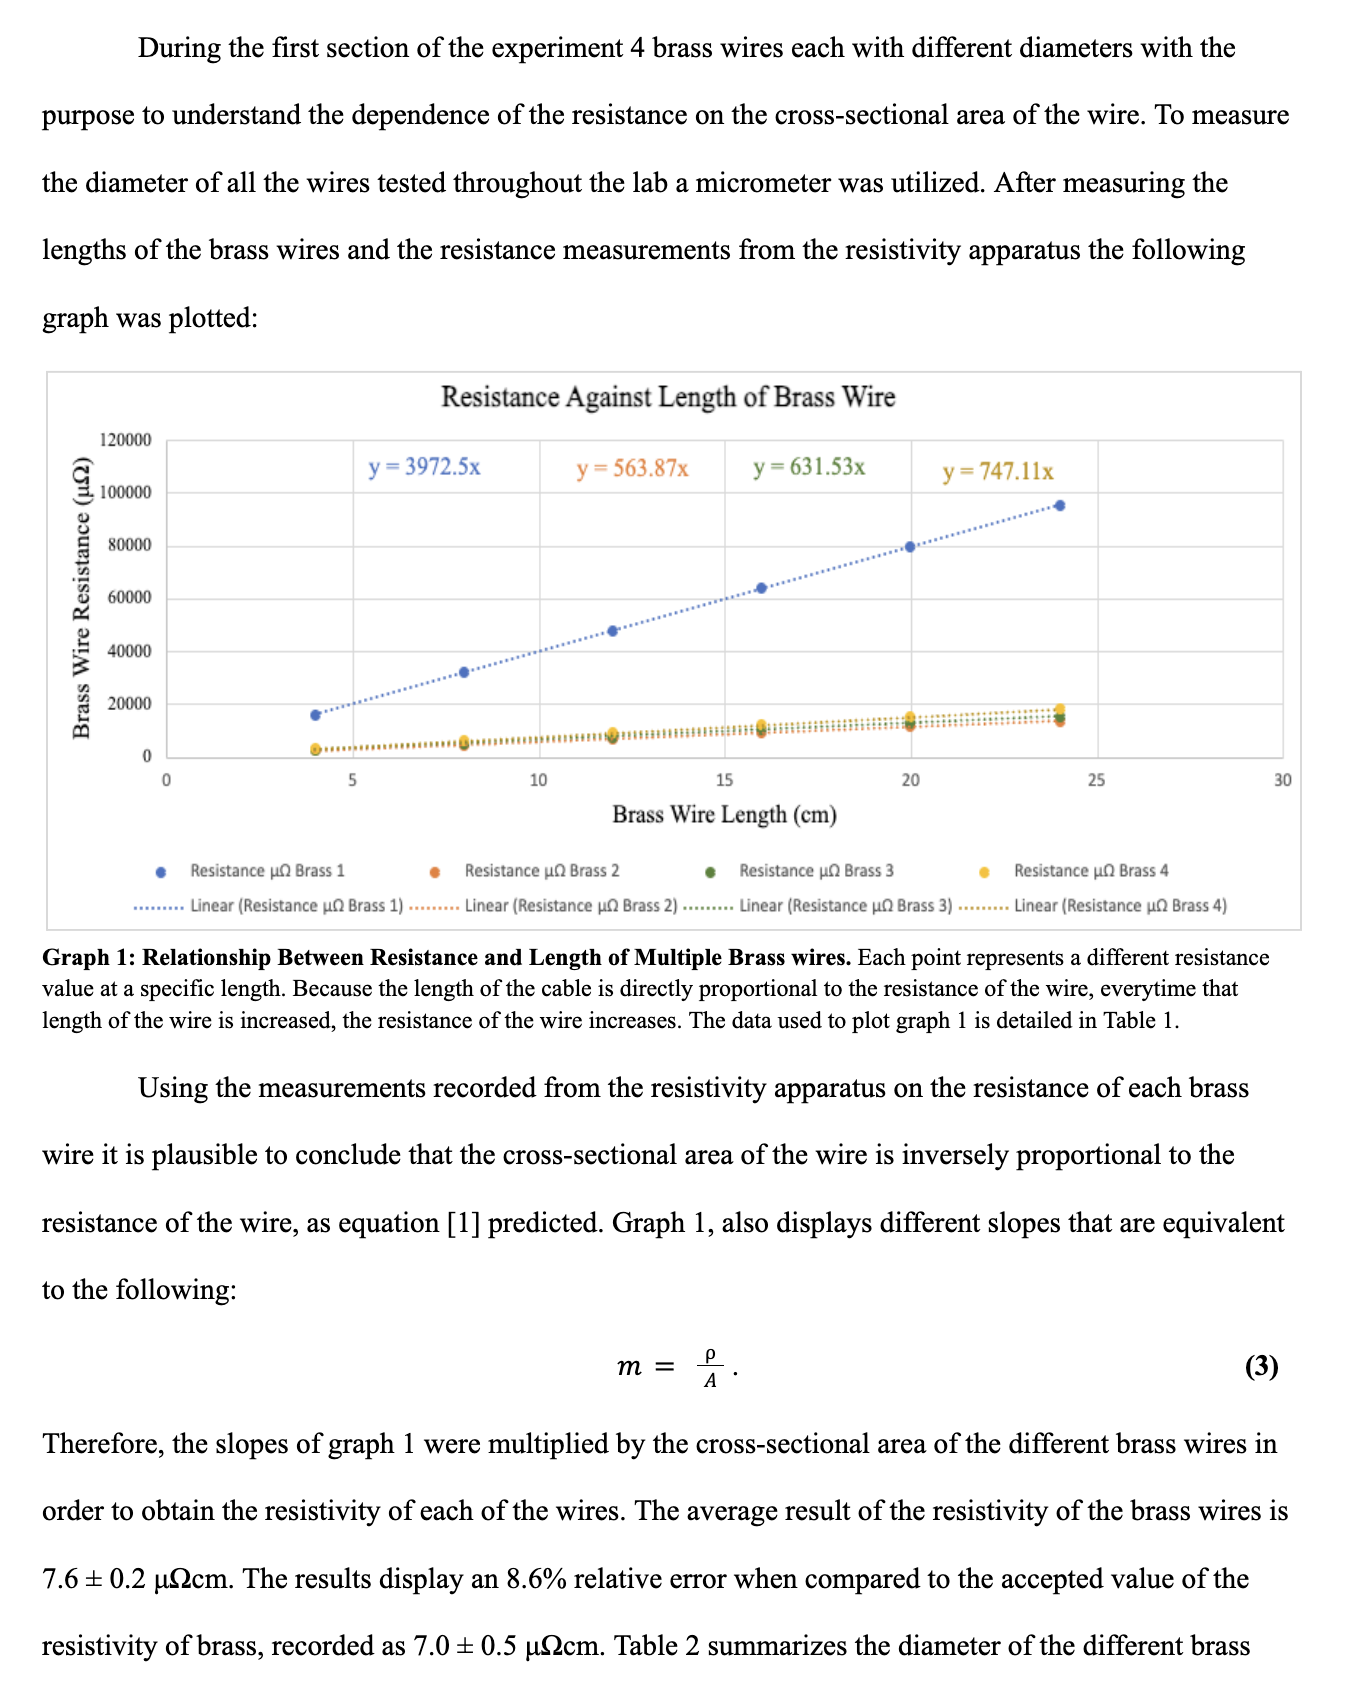
During the first section of the experiment 4 brass wires each with different diameters with the purpose to understand the dependence of the resistance

During the first section of the experiment 4 brass wires each with different diameters with the purpose to understand the dependence of the resistance on the cross-sectional area of the wire. To measure the diameter of all the wires tested throughout the lab a micrometer was utilized. After measuring the lengths of the brass wires and the resistance measurements from the resistivity apparatus the following graph was plotted: Brass Wire Resistance (2) 120000 100000 80000 60000 40000 20000 0 0 Resistance Against Length of Brass Wire y = 3972.5x 10 y = 563.87x 15 Brass Wire Length (cm) y=631.53x m = Resistance un Brass 1 Resistance un Brass 2 Resistance un Brass 3 Linear (Resistance un Brass 1)... Linear (Resistance u Brass 2). Linear (Resistance u Brass 3) P A 20 y=747.11x . 25 Graph 1: Relationship Between Resistance and Length of Multiple Brass wires. Each point represents a different resistance value at a specific length. Because the length of the cable is directly proportional to the resistance of the wire, everytime that length of the wire is increased, the resistance of the wire increases. The data used to plot graph 1 is detailed in Table 1. Using the measurements recorded from the resistivity apparatus on the resistance of each brass wire it is plausible to conclude that the cross-sectional area of the wire is inversely proportional to the resistance of the wire, as equation [1] predicted. Graph 1, also displays different slopes that are equivalent to the following: Resistance un Brass 4 Linear (Resistance u Brass 4) (3) Therefore, the slopes of graph 1 were multiplied by the cross-sectional area of the different brass wires in order to obtain the resistivity of each of the wires. The average result of the resistivity of the brass wires is 7.6 0.2 2cm. The results display an 8.6% relative error when compared to the accepted value of the resistivity of brass, recorded as 7.0 0.5 cm. Table 2 summarizes the diameter of the different brass 30
Step by Step Solution
There are 3 Steps involved in it
Step: 1

Get Instant Access to Expert-Tailored Solutions
See step-by-step solutions with expert insights and AI powered tools for academic success
Step: 2

Step: 3

Ace Your Homework with AI
Get the answers you need in no time with our AI-driven, step-by-step assistance
Get Started


