Answered step by step
Verified Expert Solution
Link Copied!

Question

1 Approved Answer

e. From your answers above, sketch a graph of Y'(t) below. f. The tValue where Y'(t) changes from increasing to decreasing is the inection point
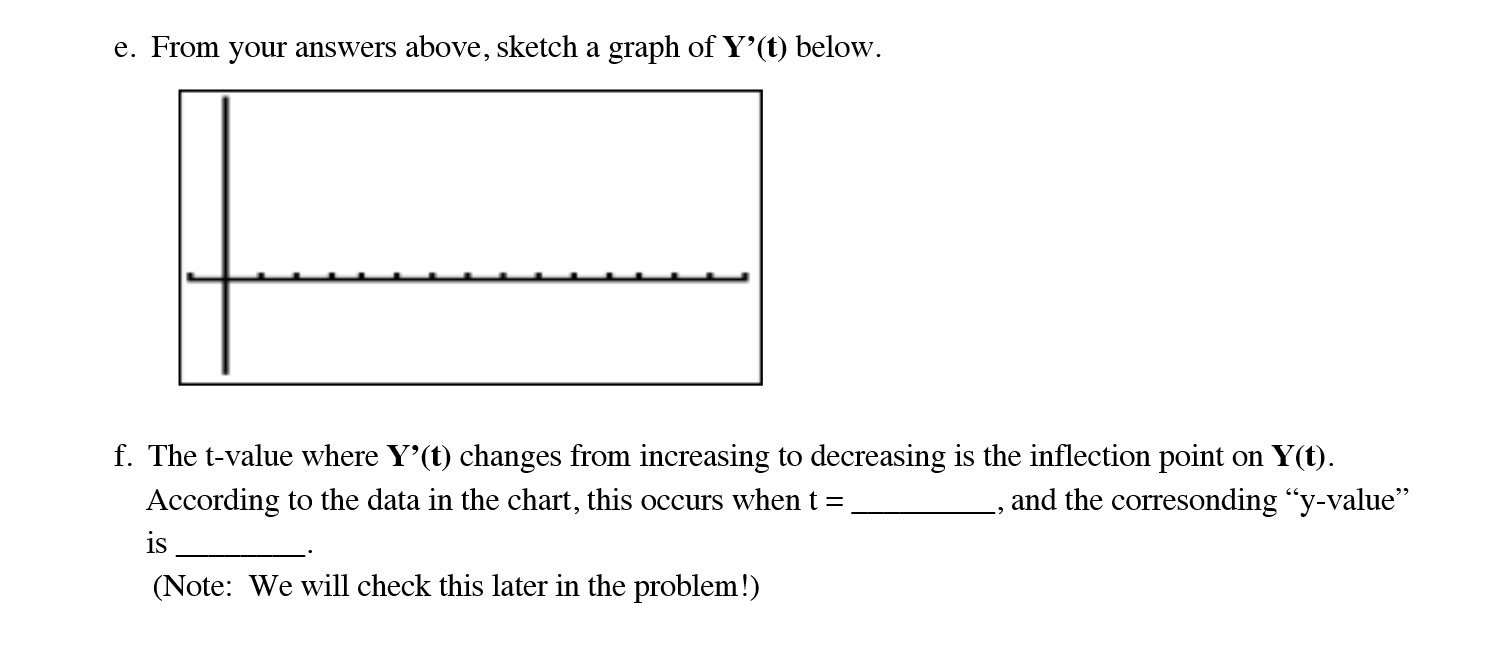
image text in transcribed
e. From your answers above, sketch a graph of Y'(t) below. f. The tValue where Y'(t) changes from increasing to decreasing is the inection point on Y(t). According to the data in the chart, this occurs when t = , and the corresondjng \"y-value\" is . (Note: We will check this later in the problem!)

Step by Step Solution

There are 3 Steps involved in it

Step: 1

blur-text-image

Get Instant Access to Expert-Tailored Solutions

See step-by-step solutions with expert insights and AI powered tools for academic success

Step: 2

blur-text-image

Step: 3

blur-text-image

Ace Your Homework with AI

Get the answers you need in no time with our AI-driven, step-by-step assistance

Get Started

Recommended Textbook for

Why Knot An Introduction To The Mathematical Theory Of Knots With Tangle

Authors: Colin Adams

1st Edition

0470413492, 978-0470413494

More Books

Students also viewed these Mathematics questions

Question

What are the net contents of the product package?

Answered: 1 week ago