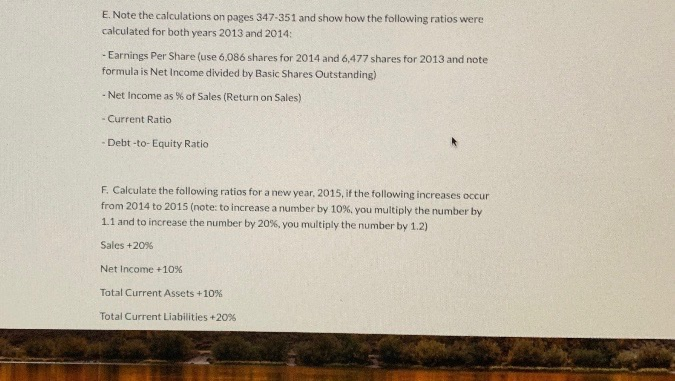
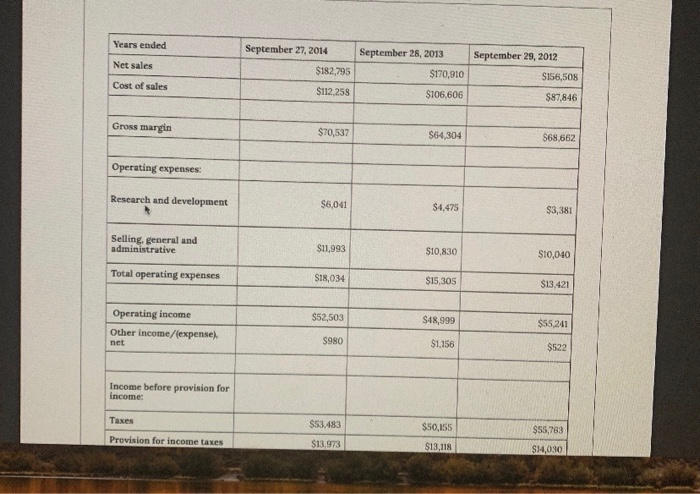
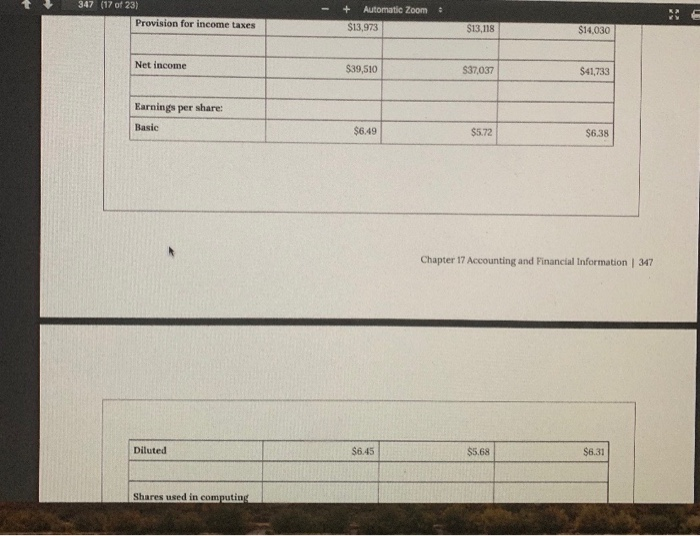
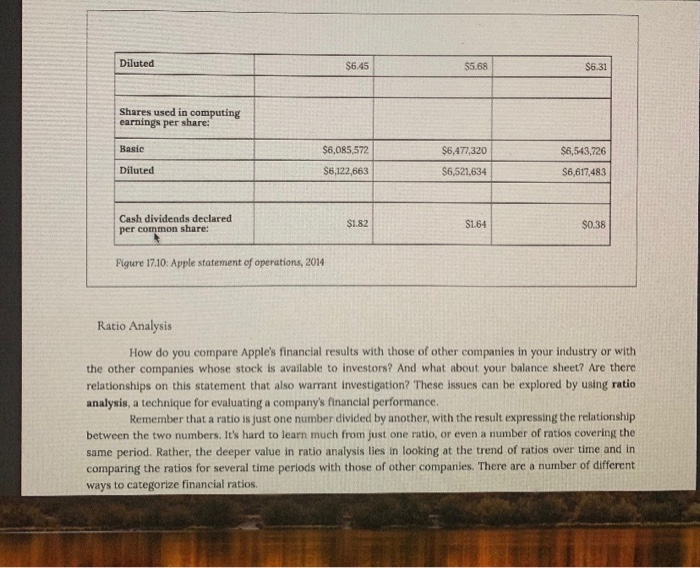
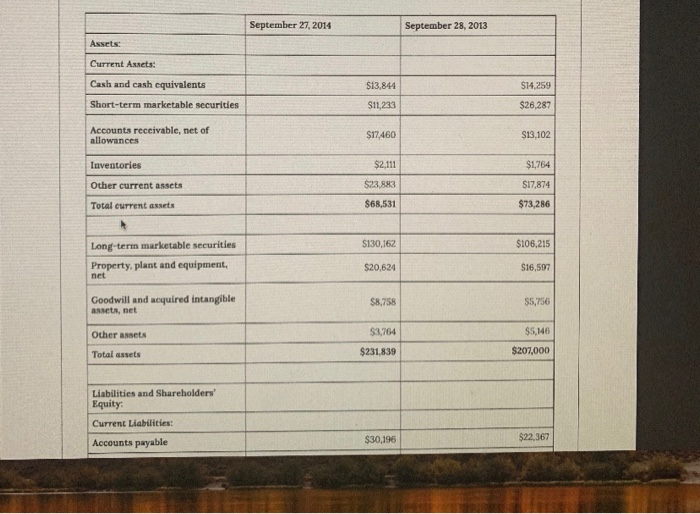
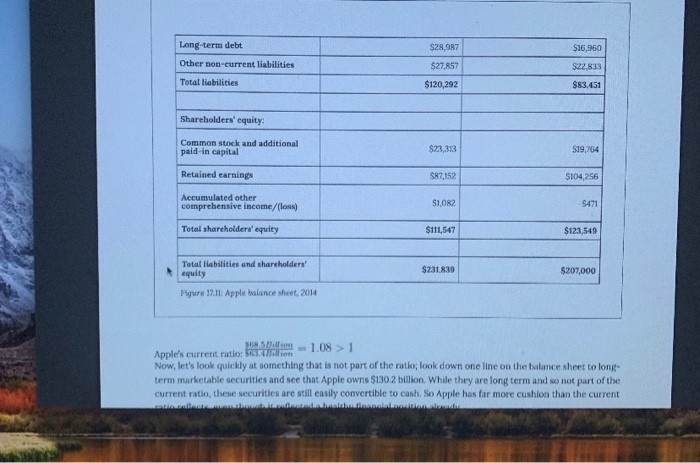
E. Note the calculations on pages 347-351 and show how the following ratios were calculated for both years 2013 and 2014: - Earnings Per Share (use 6,086 shares for 2014 and 6,477 shares for 2013 and note formula is Net Income divided by Basic Shares Outstanding) - Net Income as % of Sales (Return on Sales) - Current Ratio - Debt-to-Equity Ratio F. Calculate the following ratios for a new year 2015, if the following increases occur from 2014 to 2015 (note: to increase a number by 10%, you multiply the number by 1.1 and to increase the number by 20%, you multiply the number by 1.2) Sales +2096 Net Income +10% Total Current Assets +10% Total Current Liabilities +20% Years ended September 27, 2014 $182,795 September 28, 2013 $170,910 $106,606 September 29, 2012 SI56,508 Net sales Cost of sales $112,258 $87,846 Gross margin $70,537 $64,304 $68,662 Operating expenses: Research and development $6,041 $4,475 $3,381 Selling, general and administrative S11,993 S10830 $10,040 Total operating expenses $18,034 $15,305 $13,421 $52,503 $48,999 $55,241 Operating income Other income/[expense) $980 $1.156 S522 met Income before provision for Income: Taxes $53,483 $50,155 $55,763 $14,030 Provision for income taxes $13.973 $13.118 347 (17 of 23) Provision for income taxes : + Automatic Zoom $13,973 $13.118 $14,030 Net income $39,510 $37.037 $41,733 Earnings per share: Basic $6.49 $5.72 $6.38 Chapter 17 Accounting and Financial Information 347 Diluted $6.45 $5.68 $6.31 Shares used in computing Diluted $6.45 $5.68 S6.31 Shares used in computing earnings per share: Basic $6,085,572 $6,543,726 $6,477,320 $6,521,634 Diluted $6,122,663 $6,617,483 Cash dividends declared per common share: $1.82 $1.64 $0.38 Figure 17.10: Apple statement of operations, 2014 Ratio Analysis How do you compare Apple's financial results with those of other companies in your industry or with the other companies whose stock is available to investors? And what about your balance sheet? Are there relationships on this statement that also warrant investigation? These issues can be explored by using ratio analysis, a technique for evaluating a company's financial performance Remember that a ratio is just one number divided by another, with the result expressing the relationship between the two numbers. It's hard to learn much from just one ratio, or even a number of ratios covering the same period. Rather, the deeper value in ratio analysis lies in looking at the trend of ratios over time and in comparing the ratios for several time periods with those of other companies. There are a number of different ways to categorize financial ratios. September 27, 2014 September 28, 2013 Assets Current Assets: Cash and cash equivalents $13,844 $14,259 Short-term marketable securities $11,233 $26,287 Accounts receivable, net of allowances $17,460 $13,102 Inventories $2,111 $1,764 Other current assets $23,883 S17,874 Total current assets $68,531 $73,286 Long-term marketable securities $130,162 $106,215 Property, plant and equipment, $20,624 S16,597 net Goodwill and acquired intangible assets, net $8,758 $5,756 Other assets $3,764 $5,146 Total assets $231,839 $207,000 Liabilities and Shareholders' Equity: Current Liabilities: Accounts payable $30,196 $22,367 Long-term debt $28.987 $16,960 Other non current liabilities $27 RSE 22.833 Total liabilities $120.792 3651 Shareholders' equity. Common stock and additional paid in capital $23.33 $19.764 Retained earnings S87,152 SI04,256 Accumulated other comprehensive income/(loss) $1,082 Total shareholders' equity $111,547 $123,549 Total Ilabilities and shareholders' equity $231439 $207,000 Figure 17.11: Apple balance sheet 2014 on 11 Apple's current ratio: 1.08 > 1 Now, let's look quickly at something that is not part of the ratio, look down one line on the balance sheet to long term marketable securities and see that Apple owTis $130.2 billion. While they are long term and so not part of the Current ratio, these securities are still easily convertible to cash. So Apple has far more cushion than the current