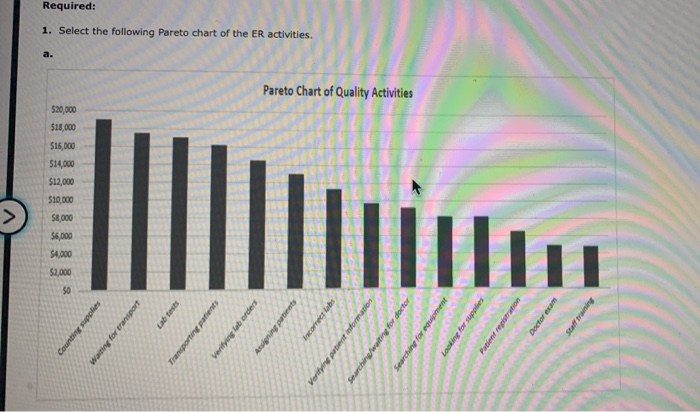
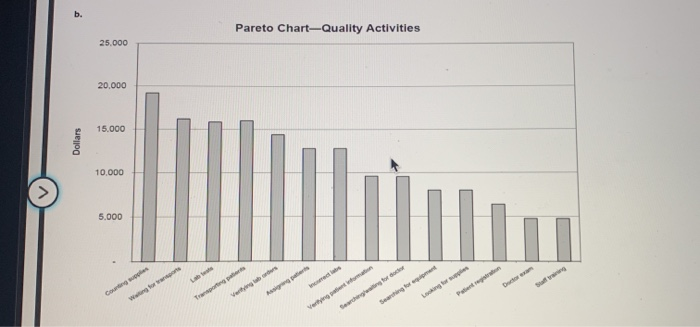
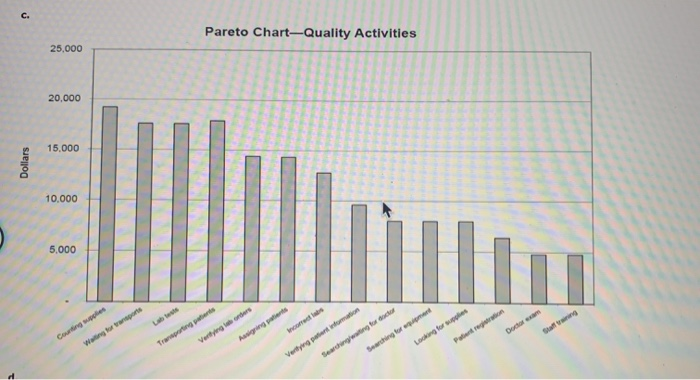
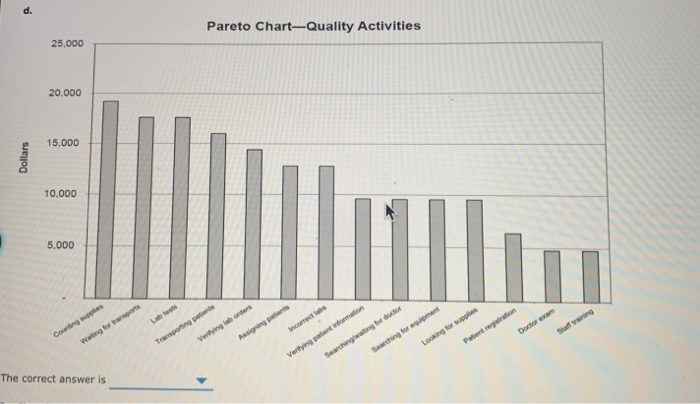
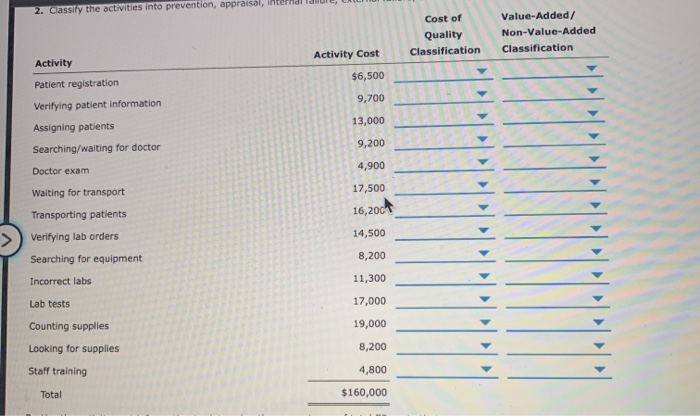
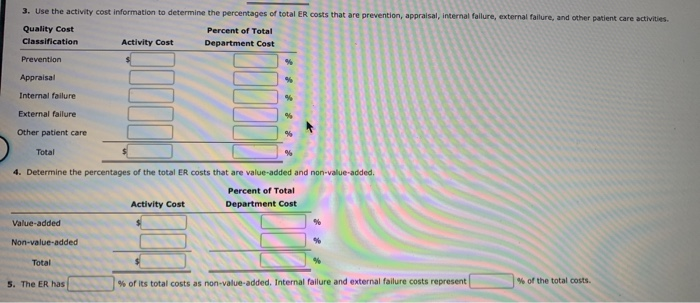
e nt care . The best and Pareto chart and cost of quality report for a service company The administrator of Uberty H a s been asked to perform an activity analysis of the mergency room . The s e co n d transportation are hospital services external to the ER for determining tema eco The rest of the activity analysis is summarised as follows: Activities Activity Cost Patient registration $6,500 Verifying patient Information 9,700 13,000 Searching/waiting for doctor 9,200 Doctor exam 4,000 Waiting for transport 17.500 Transporting patients 16.200 Verifying lab orders 14.500 Searching for evipment 8.200 Incorrect labs 11,300 Lab tests 17,000 Counting selles 19.000 Looking for u s 8.200 Staff training $160,000 To Required: 1. Select the following Pareto chart of the ER activities. Pareto Chart of Quality Activities are $20,000 $18,000 516,000 $14,000 $12,000 $10,000 $1,000 56,000 $4.000 $2,000 e Pareto Chart-Quality Activities 25.000 20.000 15.000 Dollars 10.000 5.000 Pareto Chart-Quality 25,000 20,000 15.000 Dollars 10.000 5.000 Pareto Chart-Quality Activities 25,000 20,000 15,000 Dollars 10.000 5,000 entinormation Aging hagwating for doctor Looking for supplies Searching for woment Verifying p The correct answer is l e, L 2. Cassily the activities into prevention, appraisal, interdi Cost of Quality Classification Value-Added/ Non-Value-Added Classification Activity Patient registration - - Activity Cost $6,500 9,700 13,000 9,200 Verifying patient information Assigning patients Searching/waiting for doctor 4,900 Doctor exam - Waiting for transport Transporting patients Verifying lab orders 17,500 16,2004 14,500 Searching for equipment Incorrect labs 8,200 11,300 17,000 19,000 Lab tests Counting supplies Looking for supplies 8,200 Staff training 4,800 Total $160,000 prevention, appraisal, internal failure, external failure, and other patient care activities 3. Use the activity cost information to determine the percentages of total ER costs that Quality Cost Percent of Total Classification Activity Cost Department Cost Prevention Appraisal Internal failure External failure Other patient care Total 4. Determine the percentages of the total ER costs that are value-added and non-value-added. Percent of Total Activity Cost Department Cost Value-added Non-value-added Total 5. The ER has % of its total costs as non-value-added. Internal failure and external failure costs represent of the total costs

