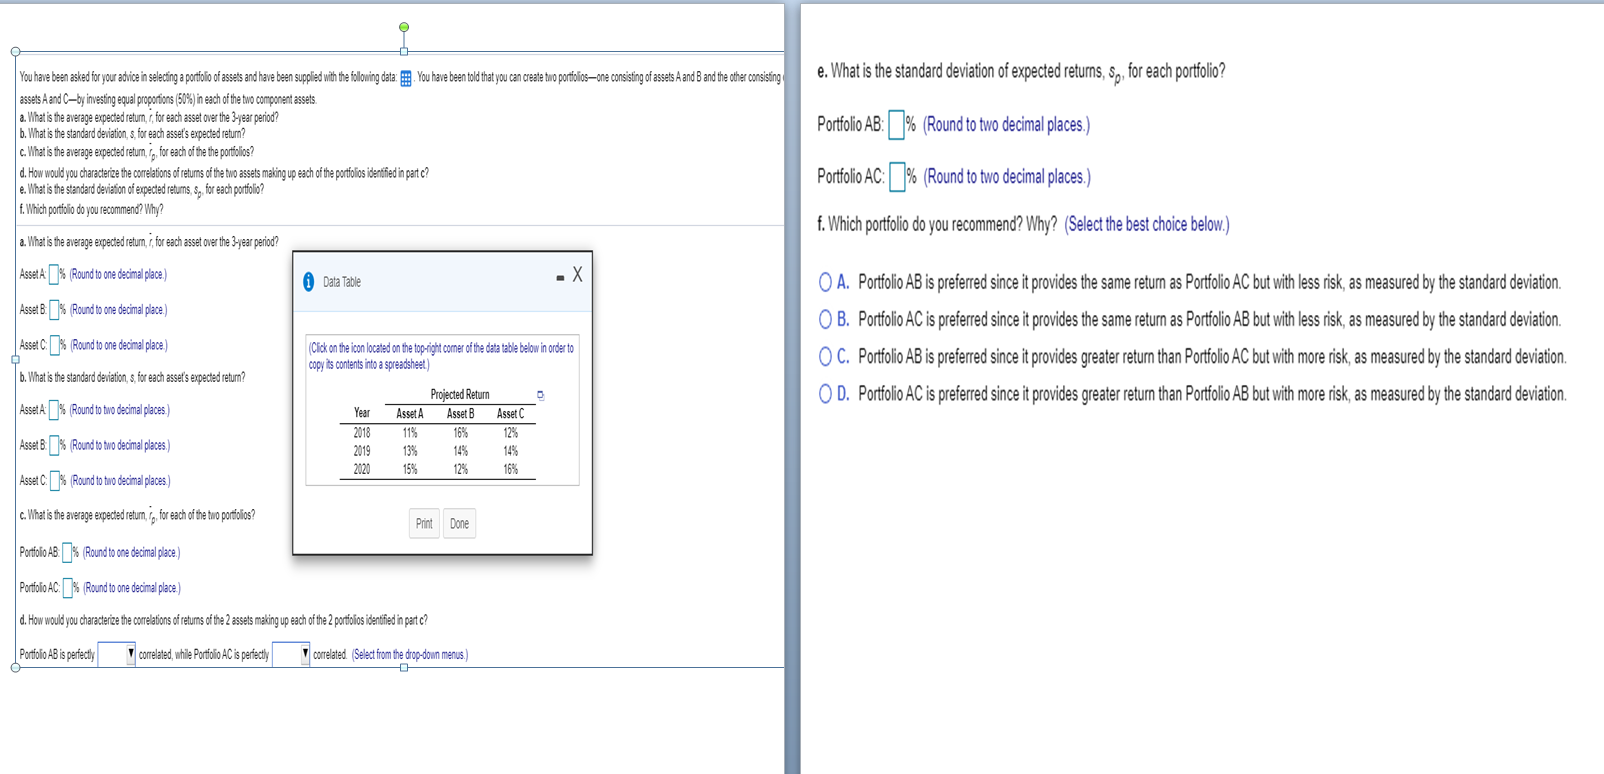
e. What is the standard deviation of expected returns, so, for each portfolio? Portfolio AB: % (Round to two decimal places.) You have been asked for your advice in selecting a portfolio of assets and have been supplied with the following data: You have been told that you can create two portfolios one consisting of assets A and B and the other consisting assets A and C-by investing equal proportions (50%) in each of the two component assets. a. What is the average expected return, r, for each asset over the 3-year period? b. What is the standard deviation, for each asset's expected return? c. What is the average expected return, t, for each of the the portfolios? d. How would you characterize the correlations of returns of the two assets making up each of the portfolios identified in partc? e. What is the standard deviation of expected returns, s, for each portfolio? f. Which portfolio do you recommend? Why? Portfolio AC: % (Round to two decimal places.) f. Which portfolio do you recommend? Why? (Select the best choice below.) a. What is the average expected return, r, for each asset over the 3-year period? Asset A % (Round to one decimal place.) i Data Table Asset B]% (Round to one decimal place) Asset C % (Round to one decimal place) O A. Portfolio AB is preferred since it provides the same return as Portfolio AC but with less risk, as measured by the standard deviation. O B. Portfolio AC is preferred since it provides the same return as Portfolio AB but with less risk, as measured by the standard deviation. O C. Portfolio AB is preferred since it provides greater return than Portfolio AC but with more risk, as measured by the standard deviation, OD. Portfolio AC is preferred since it provides greater return than Portfolio AB but with more risk, as measured by the standard deviation. (Click on the icon located on the top-right comer of the data table below in order to copy its contents into a spreadsheet) b. What is the standard deviation, s. for each asset's expected return? Asset A % (Round to two decimal places.) Asset b ]% (Round to two decimal places) Asset C % (Round to huo decimal places) Year 2018 2019 2020 Asset A 11% 13% 1 5% Projected Return Asset B 16% 14% 12% Asset C 12% 16% c. What is the average expected return, 1,, for each of the two portfolios? Print Done Portfolio AB% (Round to one decimal place.) Portfolio AC: > (Round to one decimal place) d. How would you characterize the correlations of returns of the 2 assets making up each of the 2 portfolios identified in partc? Portfolio AB is perfectly correlated, while Portfolio AC is perfectly correlated (Select from the drop-down menus


