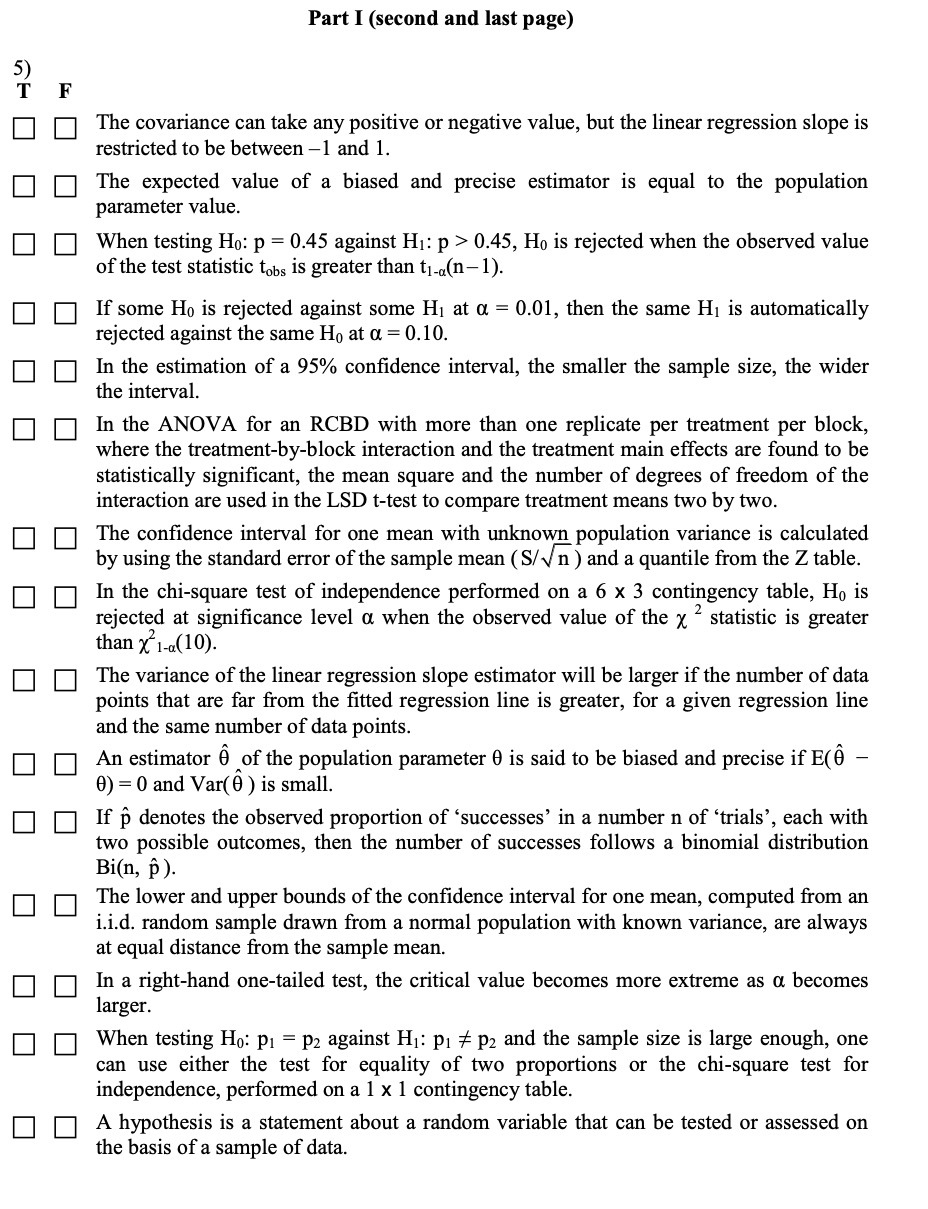
|:||:||:| |:||:||:|e13 BUDDIES\" III E III I] Part I (second and last page) The covariance can take any positive or negative value, but the linear regression slope is restricted to be between I and 1. The expected value of a biased and precise estimator is equal to the population parameter value. When testing Ha: p = {1.45 against H1: p > {1.45, Hg is rejected when the observed value of the test statistic tab, is greater than t1_u(n 1). If some Hg is rejected against some H1 at [1 = 0.01, then the same H1 is automatically rejected against the same H0 at CL = 0.10. In the estimation of a 95% condence interval, the smaller the sample size, the wider the interval. In the ANOVA for an RCBD with more than one replicate per treatment per block, where the treatment-byblock interaction and the treatment main effects are found to be statistically signicant, the mean square and the number of degrees of freedom of the interaction are used in the LSD t-test to compare treatment means two by two. The condence interval for one mean with unknown population variance is calculated by using the standard error of the sample mean (SHE ) and a quantile from the Z table. In the chi-square test of independence performed on a 6 x 3 contingency table, H0 is rejected at signicance level Ct when the observed value of the x 2 statistic is greater than {was}. The variance of the linear regression slope estimator will be larger if the number of data points that are far from the tted regression line is greater, for a given regression line and the same number of data points. An estimator Q \"of the population parameter 9 is said to be biased and precise if E03 - B) = 0 and Var( 9 ) is small. If f} denotes the observed proportion of 'successes' in a number n of 'trials', each with two possible outcomes, then the number of successes follows a binomial distribution Bi'(n1 )' The lower and upper bounds of the condence interval for one mean, computed from an i.i.d. random sample drawn from a normal population with known variance, are always at equal distance from the sample mean. In a right-hand one-tailed test, the critical value becomes more extreme as Ct becomes larger. When testing Ho: p1 = p; against H1: pl 75 p2 and the sample size is large enough, one can use either the test for equality of two proportions or the chi-square test for independence, performed on a l x 1 contingency table. A hypothesis is a statement about a random variable that can be tested or assessed on the basis of a sample of data


