Question
E7-45. Interpreting Graphical Bond Prices Consider the following price chart for Boston Scientifics 4.00% bond. The bond was issued at par in February 2018 and
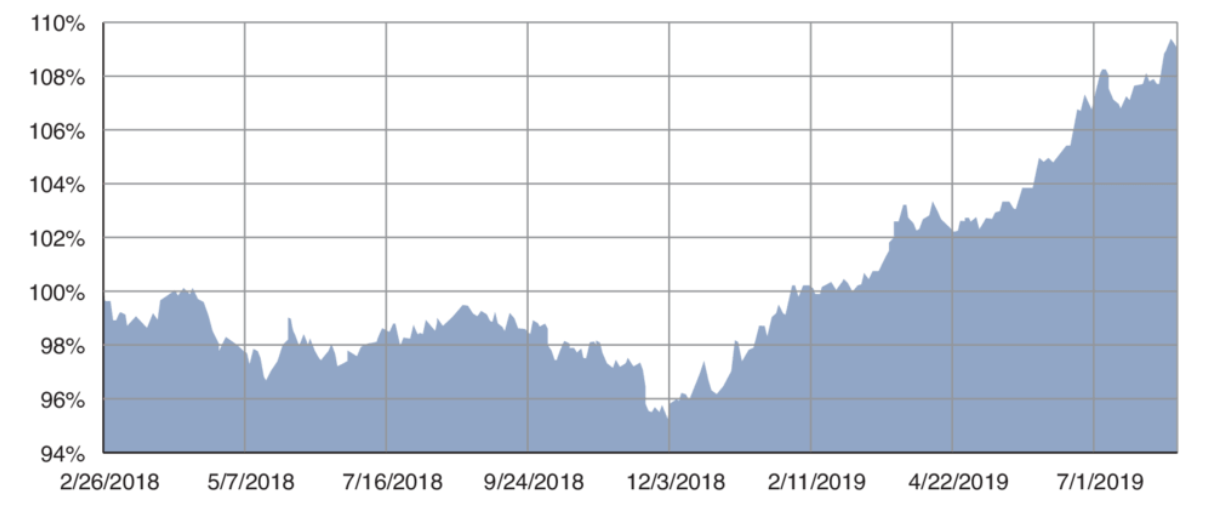
E7-45. Interpreting Graphical Bond Prices Consider the following price chart for Boston Scientifics 4.00% bond. The bond was issued at par in February 2018 and matures in March 2028. The following screen shot is from Markets Insider (August 9, 2019) and tracks the bonds daily price since issuance.

a. At what approximate price is the bond trading on August 9, 2019?
b. In late 2018, the bond was significantly below par. Explain how this could have happened.
c. Consider the price movement during 2019. What is the relation of the bonds price to its yield during this period?
d. Suggest three reasons for Boston Scientifics bond price to increase so significantly during the first half of 2019.
110% 108% 106% 104% 102% 100% 98% 96% 94% 2/26/2018 5/7/2018 7/16/2018 9/24/2018 12/3/2018 2/11/2019 4/22/2019 7/1/2019Step by Step Solution
There are 3 Steps involved in it
Step: 1

Get Instant Access to Expert-Tailored Solutions
See step-by-step solutions with expert insights and AI powered tools for academic success
Step: 2

Step: 3

Ace Your Homework with AI
Get the answers you need in no time with our AI-driven, step-by-step assistance
Get Started


