Answered step by step
Verified Expert Solution
Question
1 Approved Answer
Each group are required to download two (2) years of financial statements for their company (i.e 2013 and 2014). You may attach the financial statement
Each group are required to download two (2) years of financial statements for their company (i.e 2013 and 2014). You may attach the financial statement as appendix at the end of report.
(WE PICKED Dutch Lady Milk Industries Berhad AND Ajinomoto (Malaysia Berhad)
Required: i. Assess the financial position for two companies by calculating ratio (see table below). Your assessment must include the ASSESSMENT DETAILS followings: a. Compare the ratios for both companies.
please be specific
.
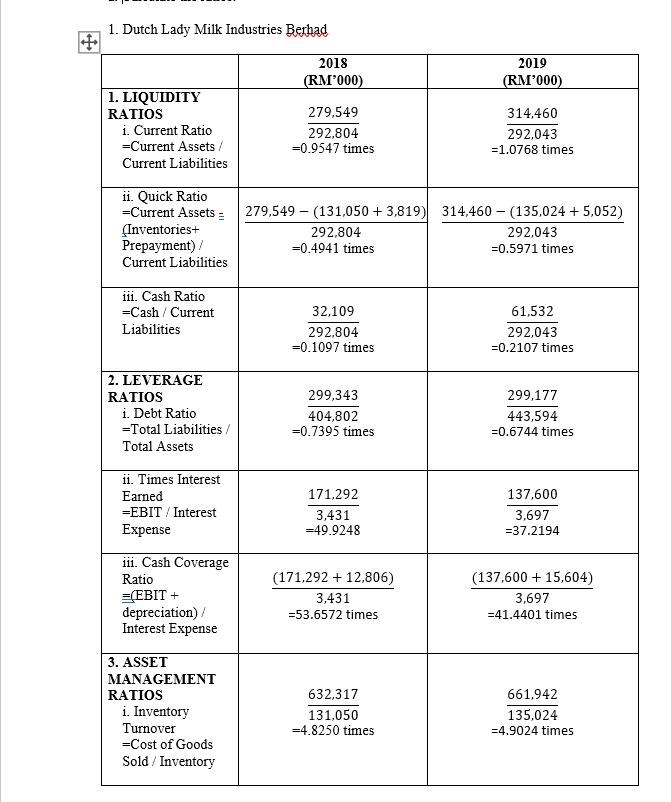
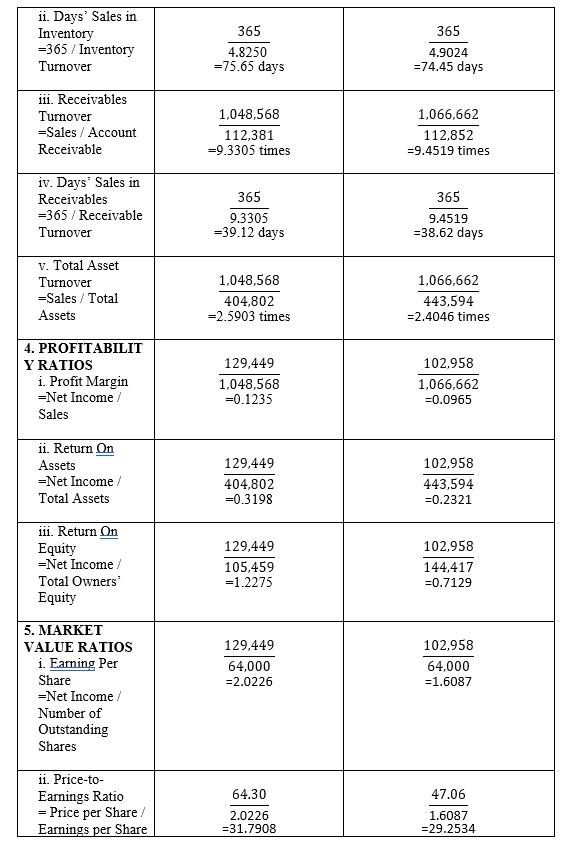
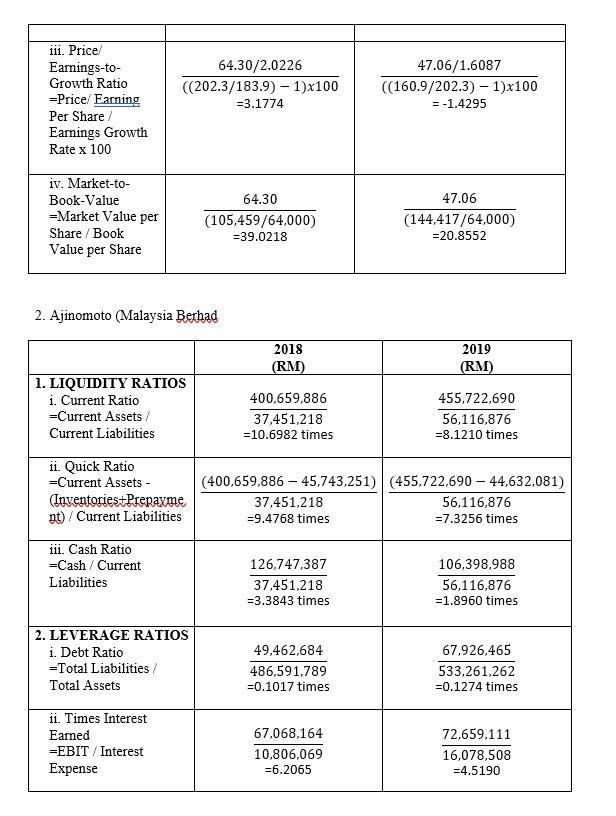
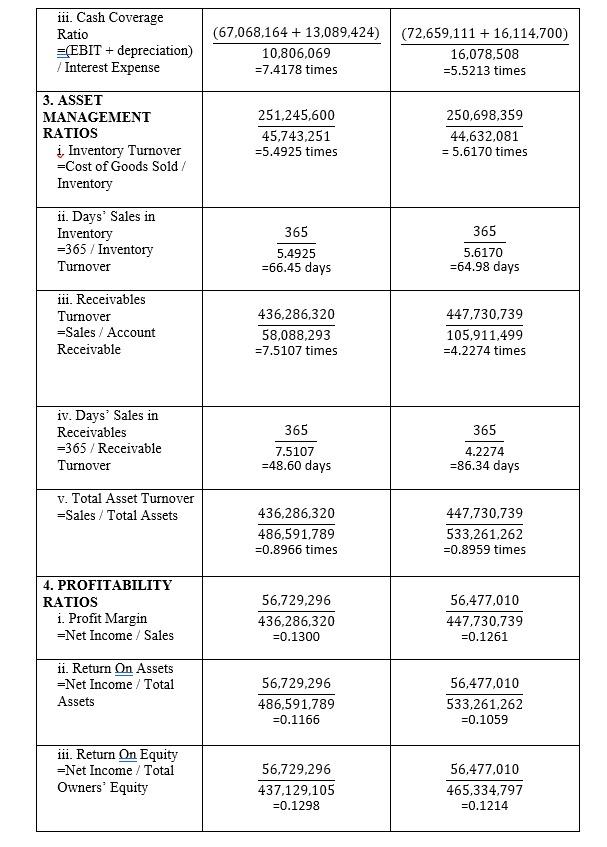
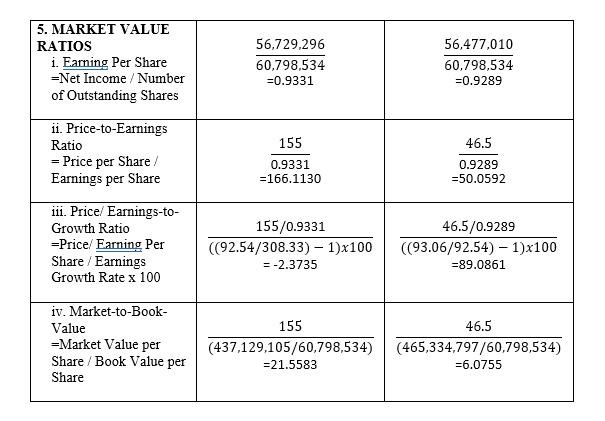
1. Dutch Lady Milk Industries Berhad 2018 (RM'000) 2019 (RM'000) 1. LIQUIDITY RATIOS i. Current Ratio =Current Assets/ Current Liabilities 279,549 292.804 =0.9547 times 314,460 292,043 =1.0768 times ii. Quick Ratio =Current Assets (Inventories+ Prepayment)/ Current Liabilities 279,549 - (131,050 + 3,819) 314,460 - (135,024 + 5,052) 292,804 292,043 =0.4941 times =0.5971 times iii. Cash Ratio =Cash / Current Liabilities 32.109 292,804 =0.1097 times 61,532 292,043 =0.2107 times 2. LEVERAGE RATIOS i. Debt Ratio =Total Liabilities/ Total Assets 299,343 404,802 =0.7395 times 299,177 443,594 =0.6744 times ii. Times Interest Earned =EBIT / Interest Expense 171,292 3,431 49.9248 137,600 3,697 =37.2194 iii. Cash Coverage Ratio (EBIT + depreciation) Interest Expense (171,292 + 12,806) 3,431 =53.6572 times (137,600 + 15,604) 3,697 =41.4401 times 3. ASSET MANAGEMENT RATIOS i. Inventory Turnover =Cost of Goods Sold / Inventory 632,317 131,050 =4.8250 times 661,942 135,024 -4.9024 times 365 ii. Days' Sales in Inventory =365 / Inventory Turnover 365 4.8250 =75.65 days 4.9024 =74.45 days iii. Receivables Turnover =Sales / Account Receivable 1,048,568 112,381 =9.3305 times 1,066,662 112,852 =9.4519 times 365 iv. Days' Sales in Receivables =365 / Receivable Turnover 365 9.3305 =39.12 days 9.4519 =38.62 days v. Total Asset Turnover =Sales/ Total Assets 1,048,568 404,802 =2.5903 times 1,066,662 443,594 =2.4046 times 4. PROFITABILIT Y RATIOS i. Profit Margin =Net Income / Sales 129,449 1,048,568 =0.1235 102.958 1,066,662 =0.0965 ii. Return On Assets =Net Income Total Assets 129,449 404,802 =0.3198 102,958 443,594 =0.2321 iii. Return on Equity =Net Income Total Owners Equity 129,449 105,459 =1.2275 102.958 144,417 =0.7129 129,449 64,000 =2.0226 5. MARKET VALUE RATIOS i. Earning Per Share =Net Income Number of Outstanding Shares 102.958 64,000 -1.6087 ii. Price-to- Earnings Ratio Price per Share / Earnings per Share 64.30 2.0226 =31.7908 47.06 1.6087 =29.2534 iii. Price/ Earnings-to- Growth Ratio =Price/ Earning Per Share Earnings Growth Rate x 100 64.30/2.0226 (202.3/183.9) - 1)x100 =3.1774 47.06/1.6087 ((160.9/202.3) - 1)x100 = -1.4295 iv. Market-to- Book-Value =Market Value per Share / Book Value per Share 64.30 (105,459/64,000) = 39.0218 47.06 (144,417/64,000) =20.8552 2. Ajinomoto (Malaysia Berhad 2018 (RM) 2019 (RM) 1. LIQUIDITY RATIOS i. Current Ratio =Current Assets/ Current Liabilities 400,659,886 37,451,218 =10.6982 times 455,722,690 56,116,876 =8.1210 times ii. Quick Ratio =Current Assets - (Inventories+Prepayme nt) / Current Liabilities (400,659,886 - 45,743,251) (455,722,690 - 44,632,081) 37,451,218 56,116,876 =9.4768 times =7.3256 times iii. Cash Ratio =Cash / Current Liabilities 126,747,387 37,451,218 =3.3843 times 106,398,988 56,116,876 =1.8960 times 2. LEVERAGE RATIOS i. Debt Ratio =Total Liabilities/ Total Assets 49,462,684 486,591,789 =0.1017 times 67,926,465 533,261,262 =0.1274 times ii. Times Interest Earned =EBIT / Interest Expense 67,068,164 10,806,069 =6.2065 72.659,111 16,078,508 =4.5190 iii. Cash Coverage Ratio (EBIT + depreciation) / Interest Expense (67,068,164 + 13,089,424) 10,806,069 =7.4178 times (72,659,111 + 16,114,700) 16,078,508 =5.5213 times 3. ASSET MANAGEMENT RATIOS i, Inventory Turnover =Cost of Goods Sold/ Inventory 251,245,600 45,743,251 =5.4925 times 250,698,359 44,632,081 = 5.6170 times 365 ii. Days' Sales in Inventory =365 / Inventory Turnover 365 5.4925 =66.45 days 5.6170 =64.98 days iii. Receivables Turnover =Sales / Account Receivable 436,286,320 58,088,293 =7.5107 times 447,730,739 105,911,499 =4.2274 times 365 iv. Days' Sales in Receivables =365 / Receivable Turnover 365 7.5107 =48.60 days 4.2274 =86.34 days v. Total Asset Turnover =Sales/Total Assets 436,286,320 486,591,789 =0.8966 times 447.730,739 533,261,262 =0.8959 times 4. PROFITABILITY RATIOS i. Profit Margin =Net Income / Sales 56,729,296 436,286,320 =0.1300 56,477,010 447.730,739 =0.1261 11. Return On Assets =Net Income / Total Assets 56,729,296 486,591,789 =0.1166 56,477,010 533.261,262 =0.1059 iii. Return On Equity =Net Income / Total Owners' Equity 56,729,296 437,129,105 =0.1298 56,477,010 465,334,797 =0.1214 5. MARKET VALUE RATIOS i. Earning Per Share =Net Income / Number of Outstanding Shares 56,729,296 60,798,534 =0.9331 56,477,010 60.798,534 =0.9289 155 0.9331 =166.1130 46.5 0.9289 =50.0592 ii. Price-to-Earnings Ratio = Price per Share / Earnings per Share iii. Price/ Earnings-to- Growth Ratio =Price/ Earning Per Share / Earnings Growth Rate x 100 iv. Market-to-Book- Value =Market Value per Share / Book Value per Share 155/0.9331 ((92.54/308.33) 1)x100 = -2.3735 46.5/0.9289 (93.06/92.54) - 1)x100 =89.0861 155 (437,129,105/60,798,534) = 21.5583 46.5 (465,334,797/60,798,534) =6.0755Step by Step Solution
There are 3 Steps involved in it
Step: 1

Get Instant Access to Expert-Tailored Solutions
See step-by-step solutions with expert insights and AI powered tools for academic success
Step: 2

Step: 3

Ace Your Homework with AI
Get the answers you need in no time with our AI-driven, step-by-step assistance
Get Started


