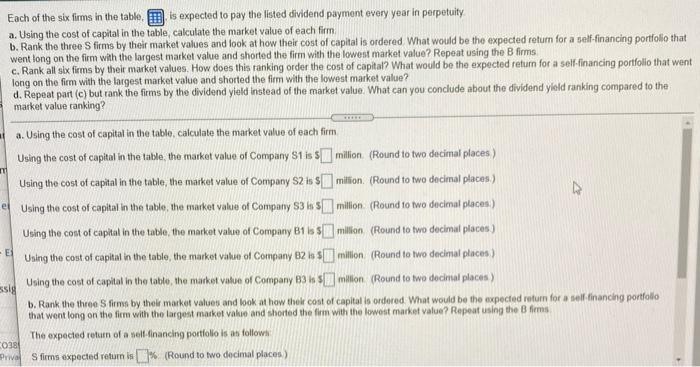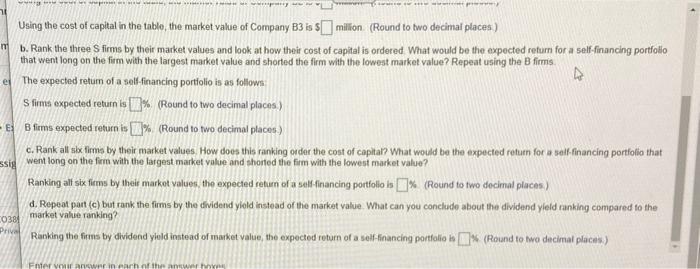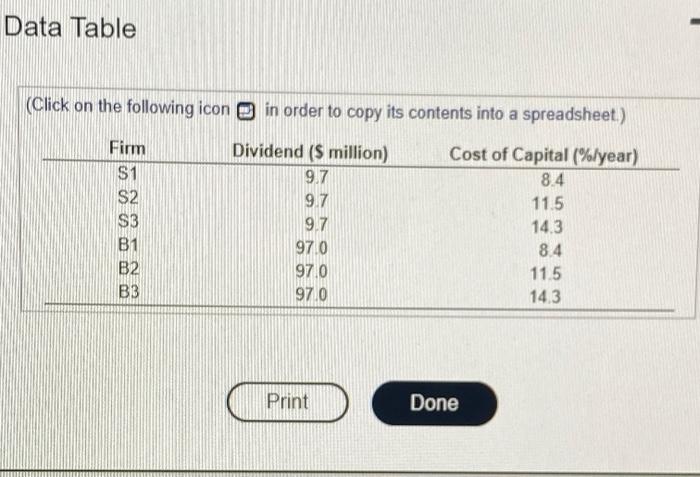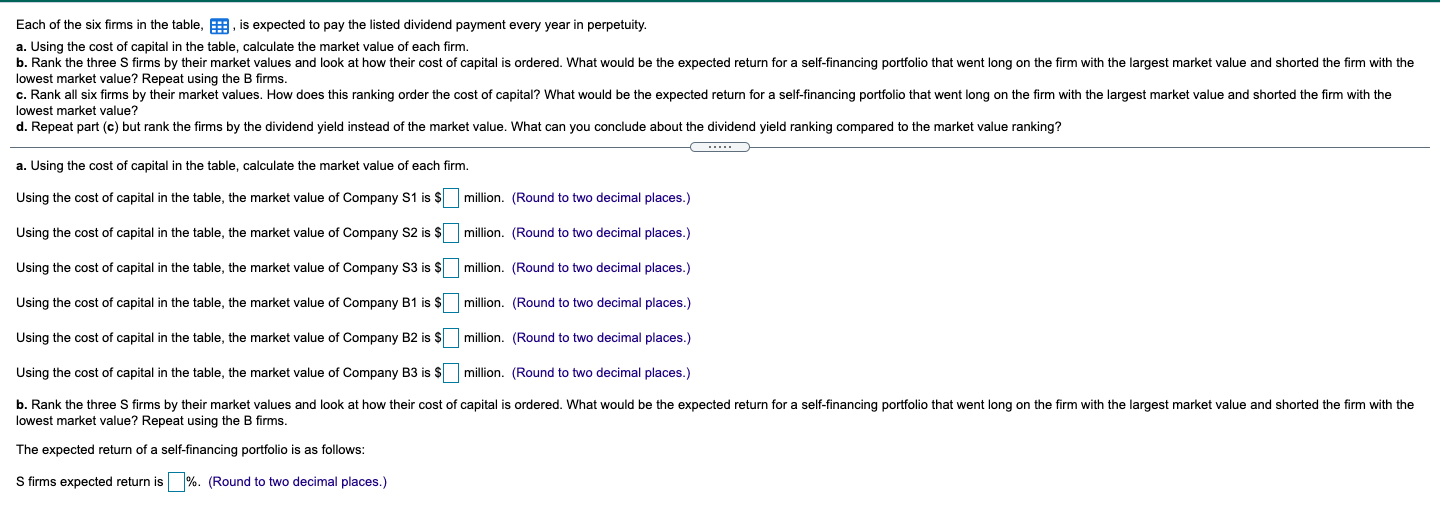
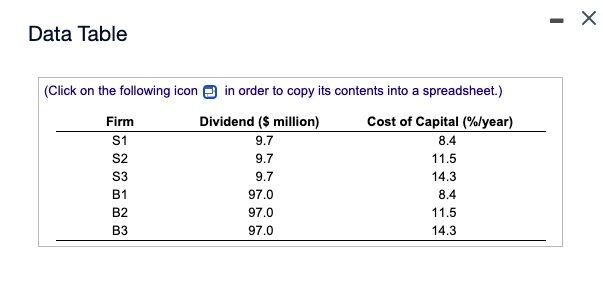
Each of the six firms in the table, is expected to pay the listed dividend payment every year in perpetuity. a. Using the cost of capital in the table, calculate the market value of each firm. b. Rank the three S firms by their market values and look at how their cost of capital is ordered. What would be the expected return for a self-financing portfolio that went long on the firm with the largest market value and shorted the firm with the lowest market value? Repeat using the B firms. c. Rank all six firms by their market values. How does this ranking order the cost of capital? What would be the expected return for a self-financing portfolio that went long on the firm with the largest market value and shorted the firm with the lowest market value? d. Repeat part (c) but rank the firms by the dividend yield instead of the market value. What can you conclude about the dividend yield ranking compared to the market value ranking? .... a. Using the cost of capital in the table, calculate the market value of each firm. Using the cost of capital in the table, the market value of Company S1 is $ million. (Round to two decimal places.) Using the cost of capital in the table, the market value of Company S2 is $ million. (Round to two decimal places.) Using the cost of capital in the table, the market value of Company S3 is $ million. (Round to two decimal places.) Using the cost of capital in the table, the market value of Company B1 is $ million. (Round to two decimal places.) Using the cost of capital in the table, the market value of Company B2 is $ million. (Round to two decimal places.) Using the cost of capital in the table, the market value of Company B3 is million. (Round to two decimal places.) b. Rank the three S firms by their market values and look at how their cost of capital is ordered. What would be the expected return for a self-financing portfolio that went long on the firm with the largest market value and shorted the firm with the lowest market value? Repeat using the B firms. The expected return of a self-financing portfolio is as follows: S firms expected return is %. (Round to two decimal places.) - Data Table (Click on the following icon in order to copy its contents into a spreadsheet.) Firm Dividend ($ million) Cost of Capital (%/year) S1 9.7 8.4 S2 9.7 11.5 S3 9.7 14.3 B1 97.0 8.4 B2 97.0 11.5 B3 97.0 14.3 Each of the six firms in the table is expected to pay the listed dividend payment every year in perpetuity a. Using the cost of capital in the table, calculate the market value of each firm b. Rank the three S firms by their market values and look at how their cost of capital is ordered What would be the expected return for a self-financing portfolio that went long on the firm with the largest market value and shorted the firm with the lowest market value? Repeat using the B firms c. Rank all six firms by their market values. How does this ranking order the cost of capital? What would be the expected return for a self-financing portfolio that went long on the firm with the largest market value and shorted the firm with the lowest market value? d. Repeat part (e) but rank the firms by the dividend yield instead of the market value. What can you conclude about the dividend yield ranking compared to the market value ranking? TE m a. Using the cost of capital in the tablo, calculate the market value of each firm Using the cost of capital in the table, the market value of Company S1 is $million (Round to two decimal places) Using the cost of capital in the table, the market value of Company S2 is $ 1 milion (Round to two decimal places) e Using the cost of capital in the table, the market value of Company S3 in 5 million (Round to two decimal places) Using the cost of capital in the table, the market value of Company B1 is $12 milion (Round to two decimal places) E Using the cost of capital in the table, the market value of Company B2 h 5 million (Round to two decimal places) sig waing the cost of capital in the table, the market value of Company B3 ha $[ millon (Round to two decimal places ) b. Rank the three firm by their market values and look at how the cost of capital is ordered. What would be the expected return for a self-financing portfolio that went long on the firm with the largest market value and shorted the firm with the lowest market value? Repeat using the firms The expected return of a self-financing portfolio is as follow C0381 ve Sims expected return is 1% (Round to two decimal places) . ei Using the cost of capital in the table, the market value of Company B3 is $(million (Round to two decimal places) b. Rank the three S firms by their market values and look at how their cost of capital is ordered What would be the expected return for a self-financing portfolio that went long on the firm with the largest market value and shorted the firm with the lowest market value? Repeat using the B firms A The expected retum of a self-financing portfolio is as follows S firma expected return is II% (Round to two decimal places) - B firms expected return is 2% (Round to two decimal places) c. Rank all six time by their market values. How does this ranking order the cost of capital? What would be the expected return for a self-financing portfolio that ssig went long on the firm with the largest market value and shorted the firm with the lowest market value? Ranking all six fiems by their market values the expected return of a self-financing portfolio is % (Round to two decimal places) d. Repeat port(e) but rank the firms by the dividend yield instead of the market value. What can you conclude about the dividend yield ranking compared to the market value ranking? Ranking the firm by dividend yould instead of market value the expected return of a self-inancing portfolio 1 % (Round to two decimal places) 0381 Prive Fnter Our war in earth Data Table (Click on the following icon in order to copy its contents into a spreadsheet.) Firm S1 S2 S3 B1 B2 B3 Dividend (5 million) 9.7 9.7 9.7 97.0 970 97.0 Cost of Capital (%/year) 8.4 11.5 14.3 8.4 11.5 14.3 Print Done


