Answered step by step
Verified Expert Solution
Link Copied!

Question

1 Approved Answer

Each person in a community was asked, What is your favorite type of pet? The pie chart below summarizes their responses. (a) Which category was
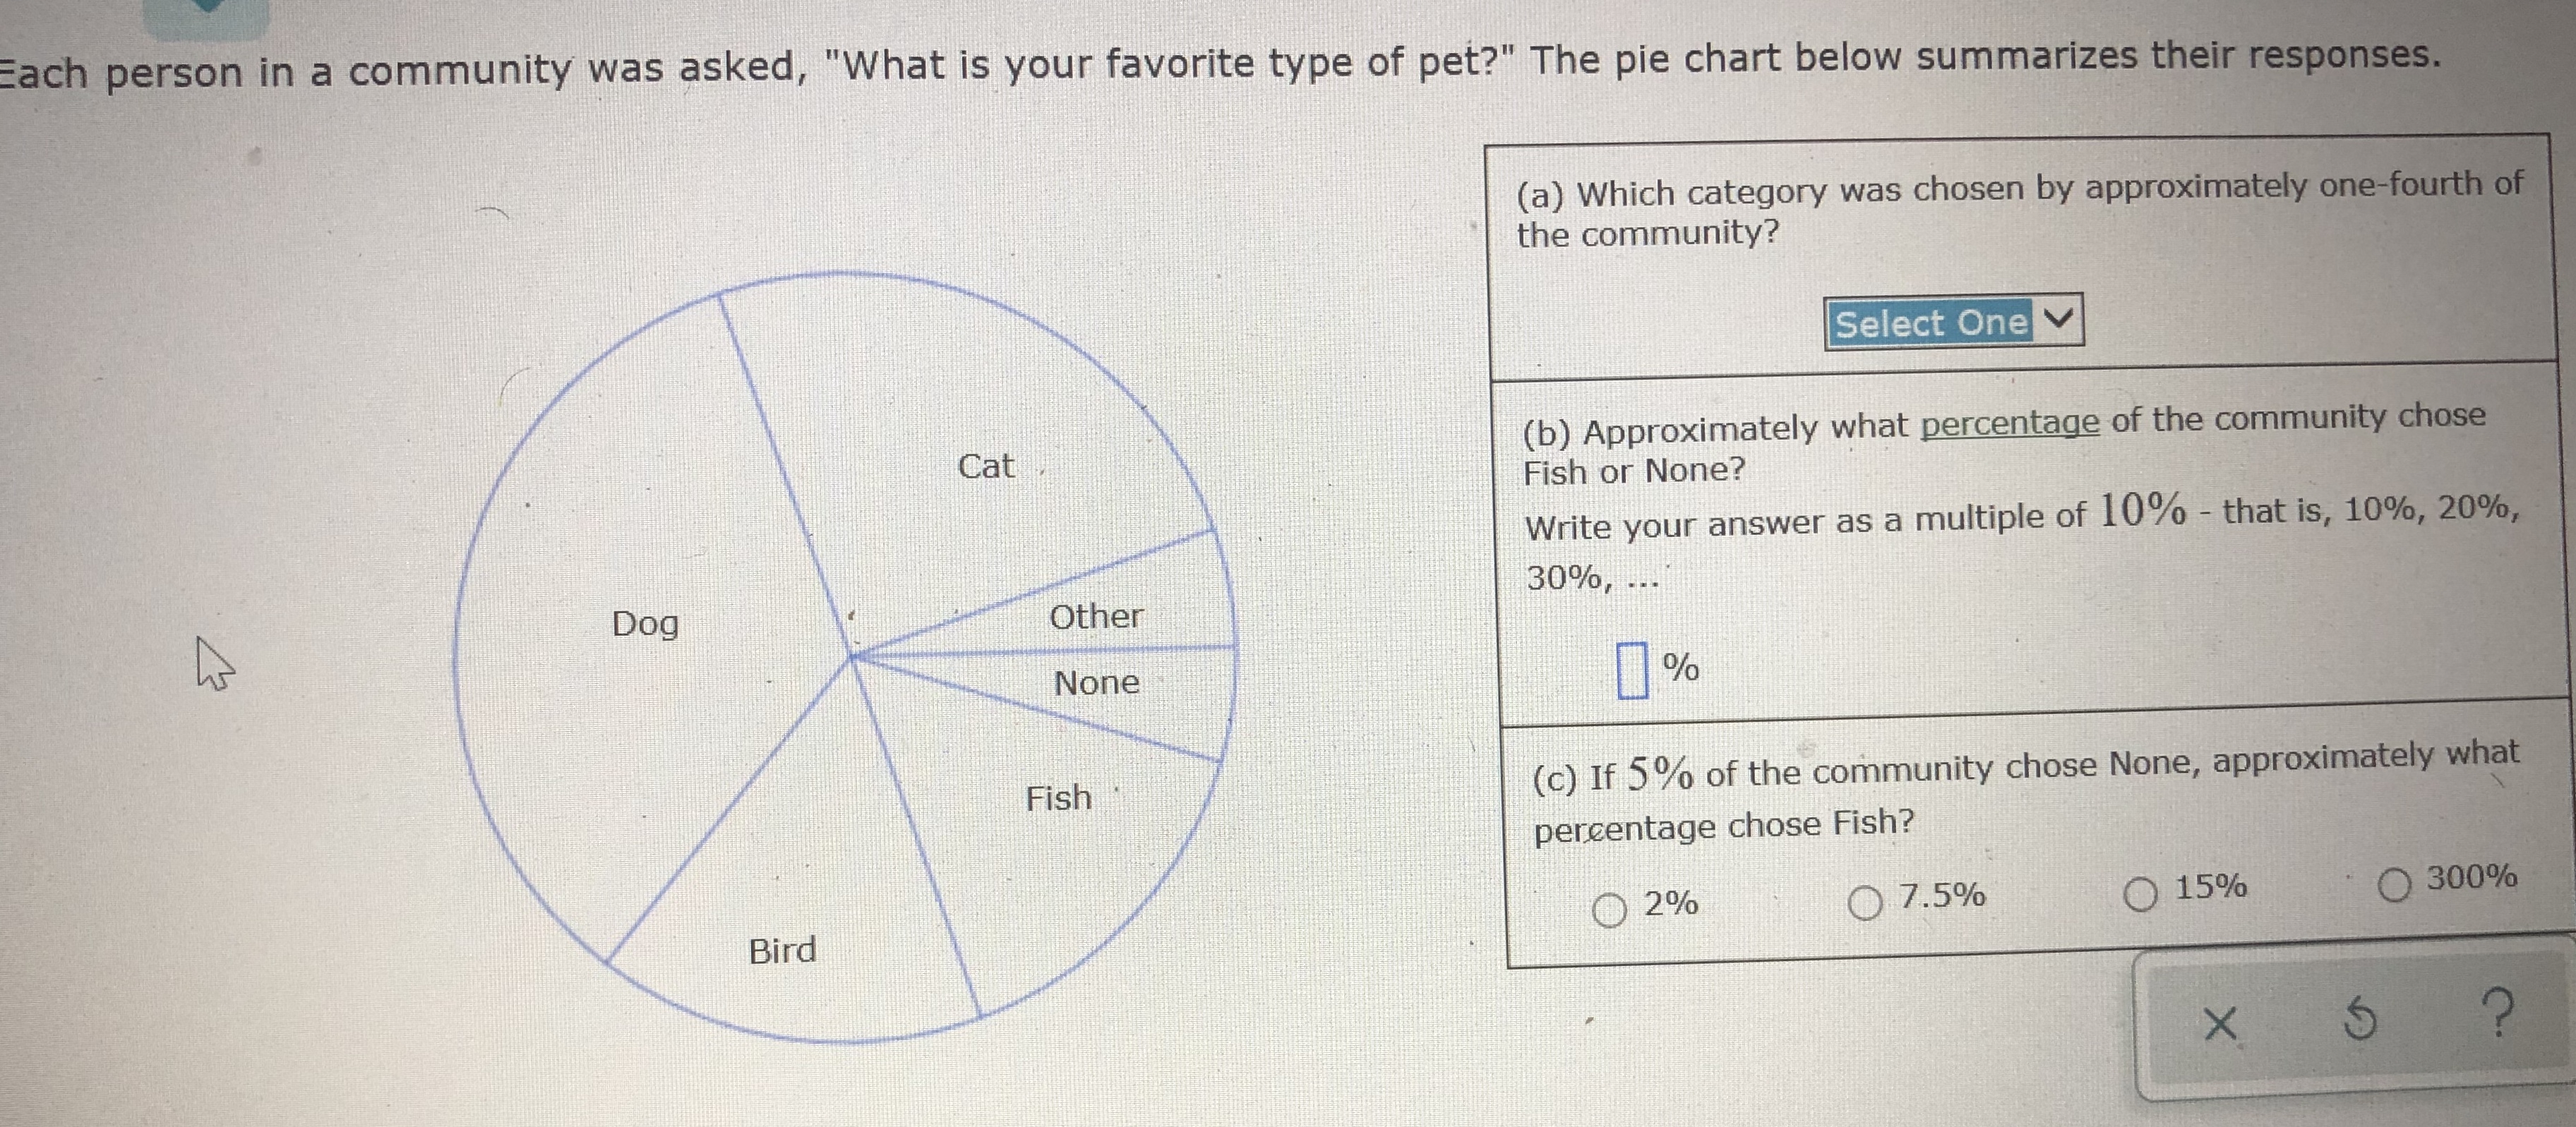
image text in transcribed
Each person in a community was asked, "What is your favorite type of pet?" The pie chart below summarizes their responses. (a) Which category was chosen by approximately one-fourth of the community? Select One V Cat (b) Approximately what percentage of the community chose Fish or None? Write your answer as a multiple of 10% - that is, 10%, 20%, his Dog Other 30%, ... None 1% Fish (c) If 5% of the community chose None, approximately what percentage chose Fish? Bird 2% O 7.5% O 15% 300% X

Step by Step Solution

There are 3 Steps involved in it

Step: 1

blur-text-image

Get Instant Access to Expert-Tailored Solutions

See step-by-step solutions with expert insights and AI powered tools for academic success

Step: 2

blur-text-image

Step: 3

blur-text-image

Ace Your Homework with AI

Get the answers you need in no time with our AI-driven, step-by-step assistance

Get Started

Recommended Textbook for

Statistical Techniques in Business and Economics

Authors: Douglas A. Lind, William G Marchal

17th edition

1259666360, 978-1259666360

More Books

Students also viewed these Mathematics questions

Question

Prove that 2n () + (G) +- C) - (")

Answered: 1 week ago