

Question
Each table in the accompanying LineFit data contains a set of data that describes a functional relationship between the dependent variable y and the independent
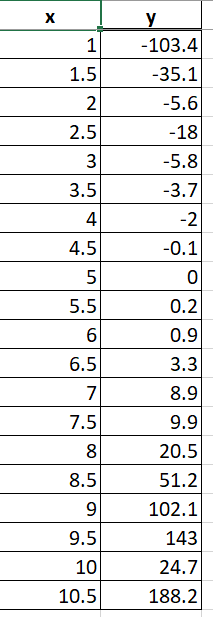
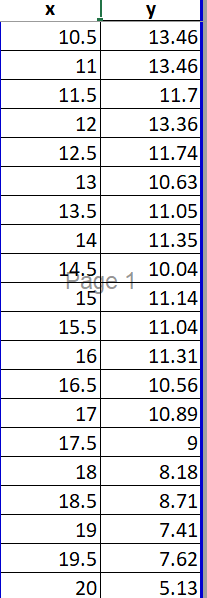
Each table in the accompanying LineFit data contains a set of data that describes a functional relationship between the dependent variable y and the independent variable x. Construct a scatter chart of each data set and use the Trendline tool in Excel to determine the best-fitting functions to model these data sets. Do not consider polynomials beyond the third degree. data set 1
data set 2
data set 3
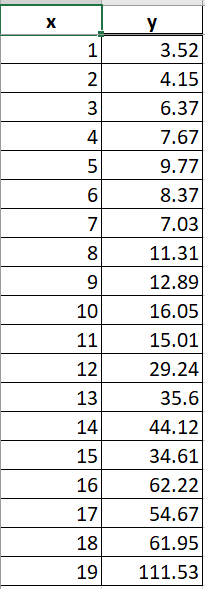
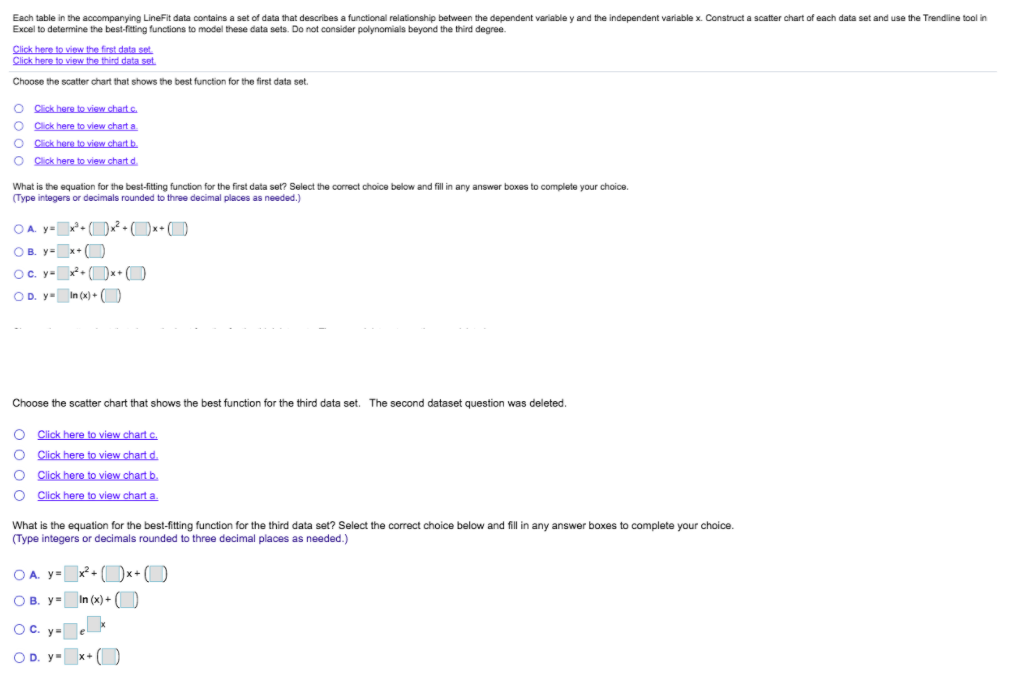
X y -103.4 1 -35.1 1.5 2 2 -5.6 2.5 3 -18 -5.8 -3.7 3.5 4 -2 4.5 -0.1 5 5 0 5.5 6 6.5 LO 0.2 0.9 3.3 8.9 7 9.9 7.5 8 8.5 9 20.5 51.2 102.1 9.5 143 10 24.7 10.5 188.2 10.5 13.46 11 13.46 11.5 11.7 12 13.36 12.5 11.74 13 10.63 13.5 11.05 14 11.35 14.5 10.04 de 1 151 11.14 15.5 11.04 16 11.31 16.5 10.56 17 10.89 17.5 9 18 8.18 18.5 8.71 19 7.41 19.5 7.62 201 5.13 X 1 3.52 4.15 6.37 WN 4 7.67 5 LO 5 6 7 8 00 9 10 9.77 8.37 7.03 11.31 12.89 16.05 15.01 29.24 35.6 11 12 13 14 15 16 44.12 34.61 62.22 54.67 61.95 111.53 17 18 19 Each table in the accompanying LineFit data contains a set of data that describes a functional relationship between the dependent variable y and the independent variable x. Construct a scatter chart of each data set and use the Trendline tool in Excel to determine the best-fitting functions to model these data sets. Do not consider polynomials beyond the third degree Click here to view the first data set. Click here to view the third data set Choose the scatter chart that shows the best function for the first data set. Click here to view charte Click here to view chart a O Click here to view chart b. O Click here to view chart d. What is the equation for the best-fitting function for the first data set? Select the correct choice below and fill in any answer boxes to complete your choice. (Type integers or decimals rounded to three decimal places as needed.) O A. yoxxx OB. y=x+ OC. - xDx- OD. y In (x) + Choose the scatter chart that shows the best function for the third data set. The second dataset question was deleted. Click here to view chart.c. Click here to view.chart d. 0 Click here to view chart b. O Click here to view chart a. What is the equation for the best-fitting function for the third data set? Select the correct choice below and fill in any answer boxes to complete your choice (Type integers or decimals rounded to three decimal places as needed.) O A. y x2+x+ OB y-In (x)+ OC. ye OD y-+ X y -103.4 1 -35.1 1.5 2 2 -5.6 2.5 3 -18 -5.8 -3.7 3.5 4 -2 4.5 -0.1 5 5 0 5.5 6 6.5 LO 0.2 0.9 3.3 8.9 7 9.9 7.5 8 8.5 9 20.5 51.2 102.1 9.5 143 10 24.7 10.5 188.2 10.5 13.46 11 13.46 11.5 11.7 12 13.36 12.5 11.74 13 10.63 13.5 11.05 14 11.35 14.5 10.04 de 1 151 11.14 15.5 11.04 16 11.31 16.5 10.56 17 10.89 17.5 9 18 8.18 18.5 8.71 19 7.41 19.5 7.62 201 5.13 X 1 3.52 4.15 6.37 WN 4 7.67 5 LO 5 6 7 8 00 9 10 9.77 8.37 7.03 11.31 12.89 16.05 15.01 29.24 35.6 11 12 13 14 15 16 44.12 34.61 62.22 54.67 61.95 111.53 17 18 19 Each table in the accompanying LineFit data contains a set of data that describes a functional relationship between the dependent variable y and the independent variable x. Construct a scatter chart of each data set and use the Trendline tool in Excel to determine the best-fitting functions to model these data sets. Do not consider polynomials beyond the third degree Click here to view the first data set. Click here to view the third data set Choose the scatter chart that shows the best function for the first data set. Click here to view charte Click here to view chart a O Click here to view chart b. O Click here to view chart d. What is the equation for the best-fitting function for the first data set? Select the correct choice below and fill in any answer boxes to complete your choice. (Type integers or decimals rounded to three decimal places as needed.) O A. yoxxx OB. y=x+ OC. - xDx- OD. y In (x) + Choose the scatter chart that shows the best function for the third data set. The second dataset question was deleted. Click here to view chart.c. Click here to view.chart d. 0 Click here to view chart b. O Click here to view chart a. What is the equation for the best-fitting function for the third data set? Select the correct choice below and fill in any answer boxes to complete your choice (Type integers or decimals rounded to three decimal places as needed.) O A. y x2+x+ OB y-In (x)+ OC. ye OD y-+
Step by Step Solution
There are 3 Steps involved in it
Step: 1

Get Instant Access to Expert-Tailored Solutions
See step-by-step solutions with expert insights and AI powered tools for academic success
Step: 2

Step: 3
Ace Your Homework with AI
Get the answers you need in no time with our AI-driven, step-by-step assistance
Get Started
Fixed Income Securities Tools For Todays Markets
Authors: Bruce Tuckman , Angel Serrat
3rd Edition
0470904038,1118133978