

Question
Each value in the table above is the maximum height for a projectile launched at the angle indicated by the row header and initial velocity
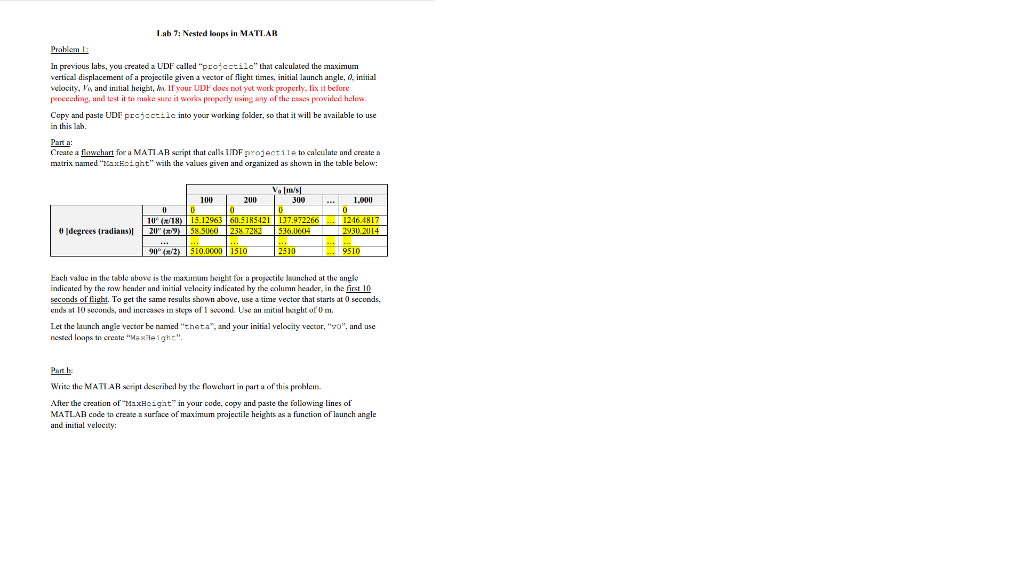
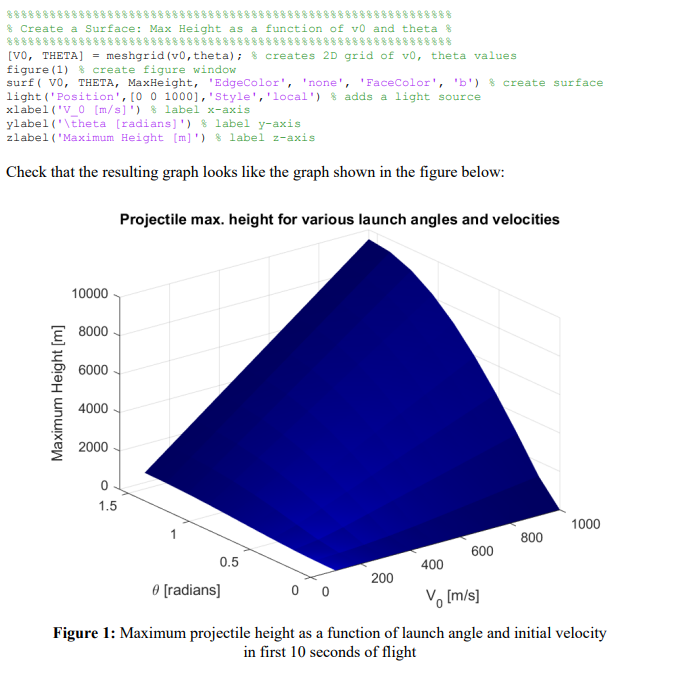
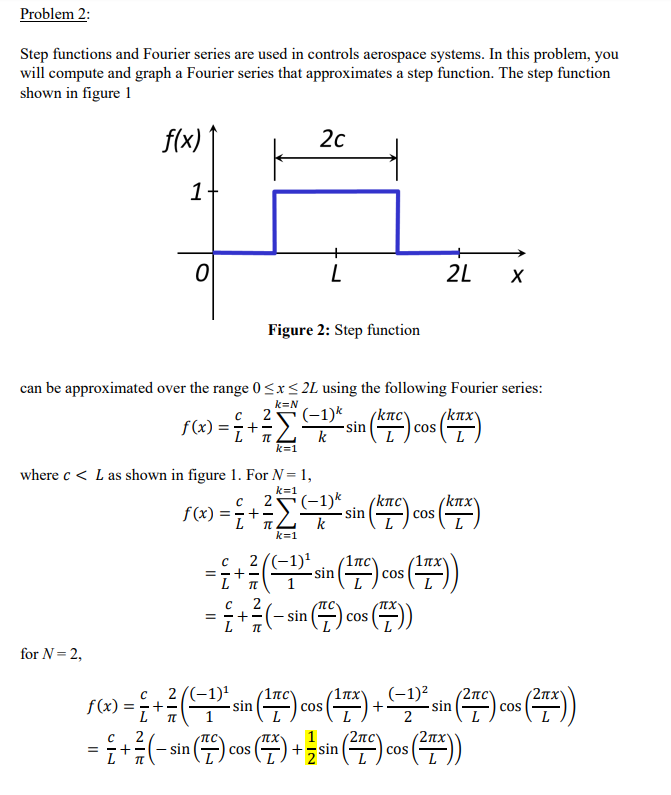
 Each value in the table above is the maximum height for a projectile launched at the angle indicated by the row header and initial velocity indicated by the column header, in the first 10 seconds of flight. To get the same results shown above, use a time vector that starts at 0 seconds, ends at 10 seconds, and increases in steps of 1 second. Use an initial height of 0 m. Let the launch angle vector be named theta, and your initial velocity vector, v0, and use nested loops to create MaxHeight. Part b: Write the MATLAB script described by the flowchart in part a of this problem. After the creation of MaxHeight in your code, copy and paste the following lines of MATLAB code to create a surface of maximum projectile heights as a function of launch angle and initial velocity: Part a: Create a flowchart for a UDF that will: Accept input variables for c, L, N, and vector of values x Approximate the step function, f(x), according to the Fourier series provided above, over the input range of x values Return an output variable for a vector of values f(x) (evaluated at each value of x) Part b: Create a MATLAB function called mystep according to your flowchart for this problem (part a). Hint: if x is a vector variable in MATLAB, y = cos(x) will create a vector y of values such that each element of y is the cosine function of each element in x. Part c: Create MATLAB script that will: Ask for user input values for c, L and N Call UDF named mystep (described in part b) to approximate f(x) for x values between 0 and 2L with a step size of 2L/100 Graph f(x) as a function of x over 0 x 2L Answer the following questions as printed text to the MATLAB Command Window: a) For N = 3, c = 1, and L = 2, does your graph of the step function look like the graph you created by hand in the in-class activities? Does your graph look like the step function in the figure above? b) What happens as you increase the value of N? Test your script and UDF with other valid values for c, L, and N, that correspond with figure 1 above, that is, c
Step by Step Solution
There are 3 Steps involved in it
Step: 1

Get Instant Access to Expert-Tailored Solutions
See step-by-step solutions with expert insights and AI powered tools for academic success
Step: 2

Step: 3
Ace Your Homework with AI
Get the answers you need in no time with our AI-driven, step-by-step assistance
Get Started
Informix Database Administrators Survival Guide
Authors: Joe Lumbley
1st Edition
0131243144, 978-0131243149