Question
Each year billions of dollars are lost because of worker injuries on the job. Costs can be decreased if injured workers can be rehabilitated quickly.
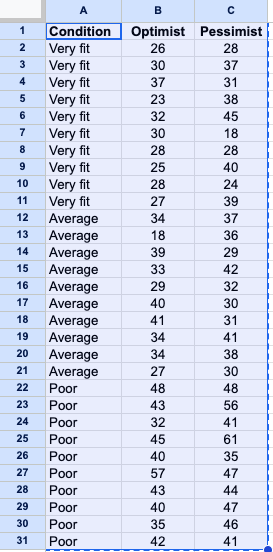
Each year billions of dollars are lost because of worker injuries on the job. Costs can be decreased if injured workers can be rehabilitated quickly. As part of an analysis of the amount of time taken for workers to return to work, a sample of male blue-collar workers aged 35 to 45 who suffered a common wrist fracture was taken. The researchers believed that the mental and physical condition of the individual affects recovery time. Each man was given a questionnaire to complete, which measured whether he tended to be optimistic or pessimistic. Their physical condition was also evaluated and categorized as very physically fit, average, or in poor condition. The number of days until the wrist returned to full function was measured for each individual. These data were recorded in the following way:
Column 1: Time to recover for optimist
(rows 1-10 = very fit,
rows 11-20 = in average condition,
rows 21-30 = poor condition
Column 2: Time to recover for pessimists (same formats as column 1)
a. What are the factors in this experiment?
What are the levels of each factors?
b. Can we conclude that pessimists and optimists differ in their recovery time?
c. Can we conclude that physical condition affects recovery time?

Step by Step Solution
There are 3 Steps involved in it
Step: 1

Get Instant Access to Expert-Tailored Solutions
See step-by-step solutions with expert insights and AI powered tools for academic success
Step: 2

Step: 3

Ace Your Homework with AI
Get the answers you need in no time with our AI-driven, step-by-step assistance
Get Started


