Answered step by step
Verified Expert Solution
Question
1 Approved Answer
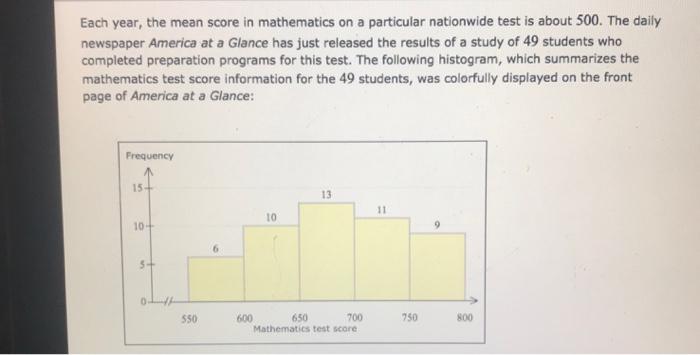
Each year, the mean score in mathematics on a particular nationwide test is about 500. The daily newspaper America at a Glance has just


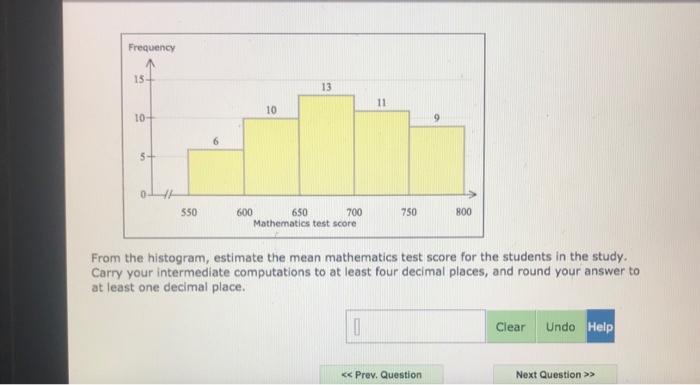
Each year, the mean score in mathematics on a particular nationwide test is about 500. The daily newspaper America at a Glance has just released the results of a study of 49 students who completed preparation programs for this test. The following histogram, which summarizes the mathematics test score information for the 49 students, was colorfully displayed on the front page of America at a Glance: Frequency 15 13 11 10 10 600 Mathematics test score 550 650 700 750 800 Frequency 15 13 10 10+ 9. 5- 550 600 750 650 Mathematics test score 700 800 From the histogram, estimate the mean mathematics test score for the students in the study. Carry your intermediate computations to at least four decimal places, and round your answer to at least one decimal place. Clear Undo Help Prev. Question Next Question >> Each year, the mean score in mathematics on a particular nationwide test is about 500. The daily newspaper America at a Glance has just released the results of a study of 49 students who completed preparation programs for this test. The following histogram, which summarizes the mathematics test score information for the 49 students, was colorfully displayed on the front page of America at a Glance: Frequency 15 13 11 10 10 600 Mathematics test score 550 650 700 750 800 Frequency 15 13 10 10+ 9. 5- 550 600 750 650 Mathematics test score 700 800 From the histogram, estimate the mean mathematics test score for the students in the study. Carry your intermediate computations to at least four decimal places, and round your answer to at least one decimal place. Clear Undo Help Prev. Question Next Question >> Each year, the mean score in mathematics on a particular nationwide test is about 500. The daily newspaper America at a Glance has just released the results of a study of 49 students who completed preparation programs for this test. The following histogram, which summarizes the mathematics test score information for the 49 students, was colorfully displayed on the front page of America at a Glance: Frequency 15 13 11 10 10 600 Mathematics test score 550 650 700 750 800 Frequency 15 13 10 10+ 9. 5- 550 600 750 650 Mathematics test score 700 800 From the histogram, estimate the mean mathematics test score for the students in the study. Carry your intermediate computations to at least four decimal places, and round your answer to at least one decimal place. Clear Undo Help Prev. Question Next Question >>
Step by Step Solution
★★★★★
3.39 Rating (155 Votes )
There are 3 Steps involved in it
Step: 1
for abvoe data mid frequencyf ...
Get Instant Access to Expert-Tailored Solutions
See step-by-step solutions with expert insights and AI powered tools for academic success
Step: 2

Step: 3

Ace Your Homework with AI
Get the answers you need in no time with our AI-driven, step-by-step assistance
Get Started


