Question
The daily newspaper America at a Glance has just released the results of a study of 50 students who completed preparation programs for a nationwide,
The daily newspaper America at a Glance has just released the results of a study of 50 students who completed preparation programs for a nationwide, standardized test. The following histogram, which summarizes the mathematics test score information for the students, was colorfully displayed on the front page of America at a Glance:

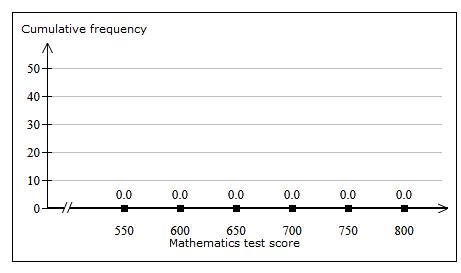
Based on this histogram, draw the ogive (the cumulative frequency polygon) for the test score data.

Frequency 20 16 15 12 12 10+ 5 5 5+ 550 600 650 Mathematics test score 700 750 800
Step by Step Solution
3.41 Rating (157 Votes )
There are 3 Steps involved in it
Step: 1

Get Instant Access to Expert-Tailored Solutions
See step-by-step solutions with expert insights and AI powered tools for academic success
Step: 2

Step: 3

Ace Your Homework with AI
Get the answers you need in no time with our AI-driven, step-by-step assistance
Get StartedRecommended Textbook for
Microeconomics
Authors: David Besanko, Ronald Braeutigam
5th edition
1118572270, 978-1118799062, 1118799062, 978-1118572276
Students also viewed these Mathematics questions
Question
Answered: 1 week ago
Question
Answered: 1 week ago
Question
Answered: 1 week ago
Question
Answered: 1 week ago
Question
Answered: 1 week ago
Question
Answered: 1 week ago
Question
Answered: 1 week ago
Question
Answered: 1 week ago
Question
Answered: 1 week ago
Question
Answered: 1 week ago
Question
Answered: 1 week ago
Question
Answered: 1 week ago
Question
Answered: 1 week ago
Question
Answered: 1 week ago
Question
Answered: 1 week ago
Question
Answered: 1 week ago
Question
Answered: 1 week ago
Question
Answered: 1 week ago
Question
Answered: 1 week ago
Question
Answered: 1 week ago
Question
Answered: 1 week ago
Question
Answered: 1 week ago
Question
Answered: 1 week ago
View Answer in SolutionInn App


